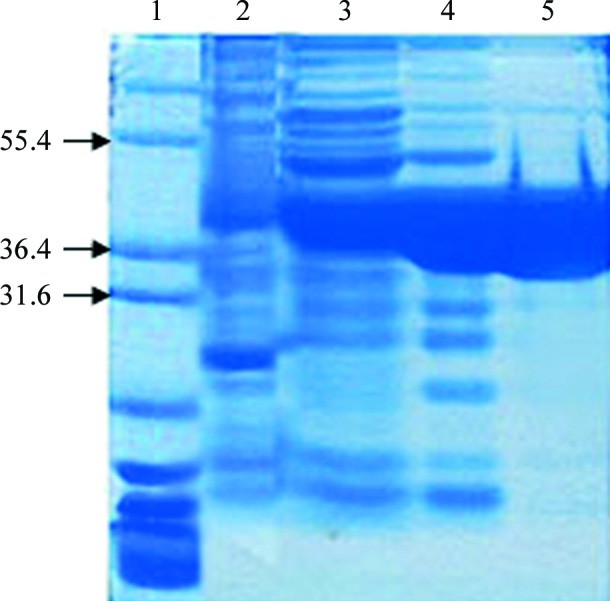
Figure 1.

SDS–PAGE analysis of NheA purification. Lane 1, Marker12 (molecular-weights are indicated in kDa on the left); lane 2, cell extract; lane 3, after DEAE Sepharose column; lane 4, after hydroxylapatite (HA) column; lane 5, after gel-filtration column.
