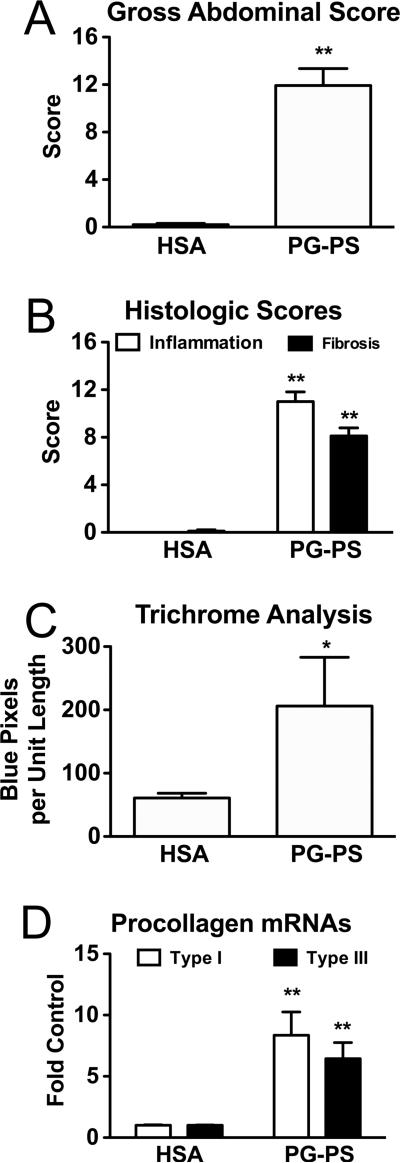
Figure 1.
By all measurements used, vehicle-treated PG-PS-injected rats developed more fibrosis at d28 post-injection than did vehicle-treated HSA-injected rats. All results shown are means; error bars reflect SEM. A.) PG-PS-injected animals had greater gross abdominal scores (p<0.001), which are the sums of the scores for adhesions, cecal wall thickening, mesenteric thickening and contraction, cecal granulomas, and liver granulomas, each graded on a scale of 0– 4, with a maximum possible score of 20. (n=15/group; combined data from all 3 experiments) B.) PG-PS-injected animals had greater histologic inflammation and fibrosis scores when H&E and trichrome stained sections of cecum were examined in a blinded manner and scored for the amounts of inflammation and fibrosis as described in Methods (inflammation score – open bars; fibrosis score – filled bars; maximum possible score for each is 16; p<0.00000001 for both; n=9/group; combined data from the 40 and 100 mg/kg/d experiments). C.) The collagen content of cecal tissue, as analyzed by colorimetric analysis of digital images of trichrome stained sections, was also greater in PG-PS-injected than in HSA-injected animals (p<0.02). Collagen is stained blue in the trichrome system used; thus blue pixels reflect collagen. Variation in the sizes of the pieces of tissue analyzed was controlled for by normalizing to tissue length. (n=9/group; combined data from the 40 and 100 mg/kg/d experiments) D.) Cecal tissue of PGPS-injected rats had increased procollagen type I (open bars; p<0.001) and procollagen type III (filled bars; p<0.001) mRNA expression as measured by quatitative real-time PCR; the results were normalized to GAPDH and expressed as fold the mean HSA-injected control value. (n=9/group; combined data from the 40 and 100 mg/kg/d experiments)

