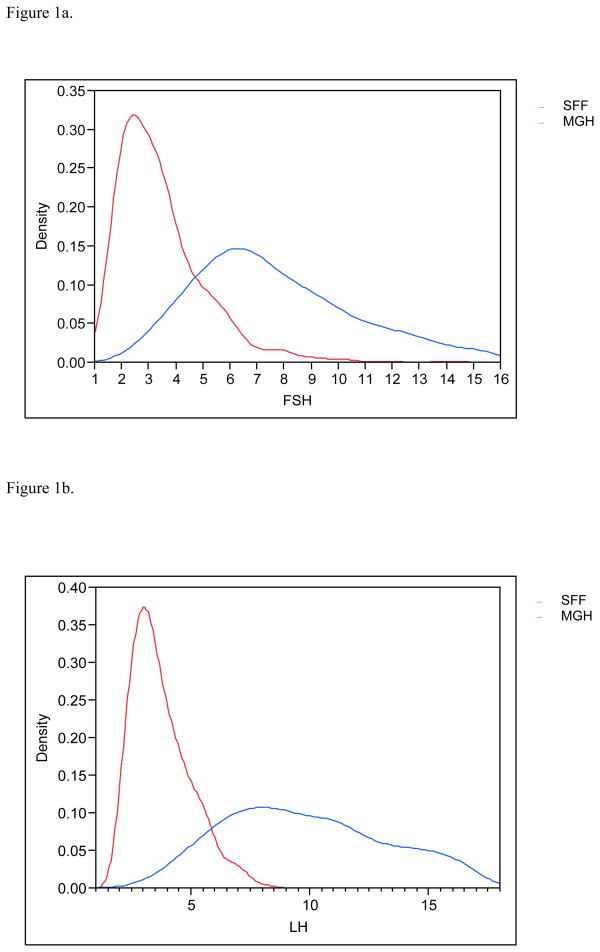
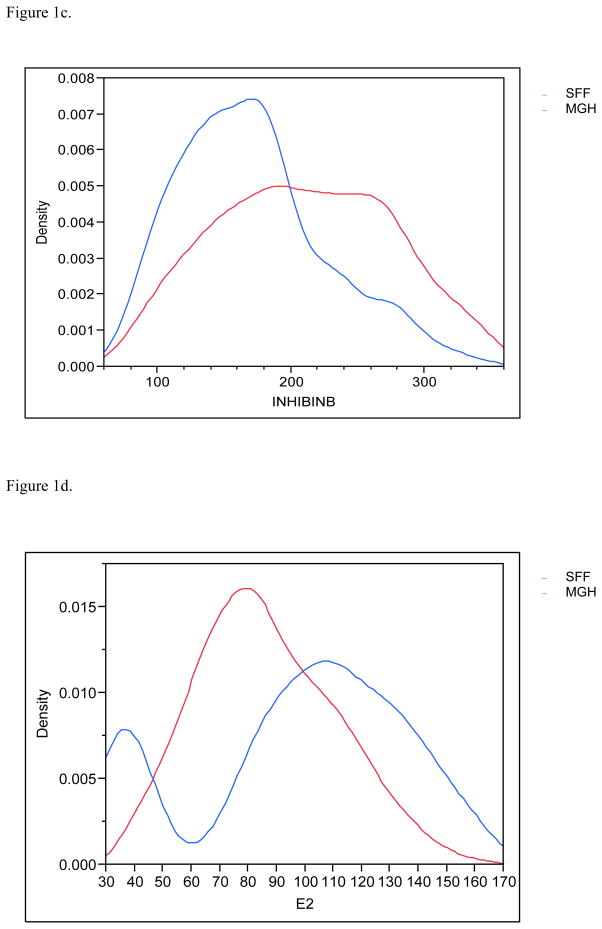
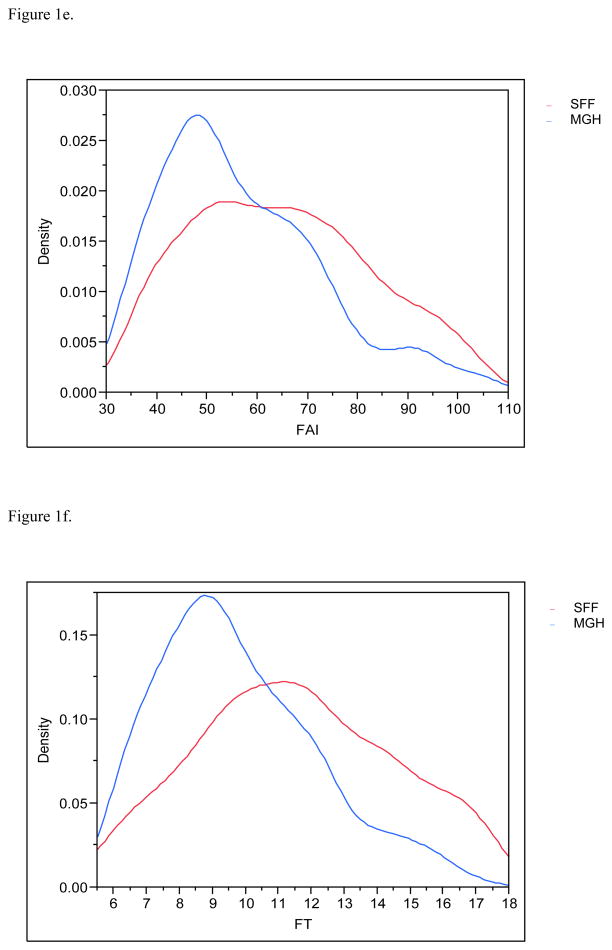
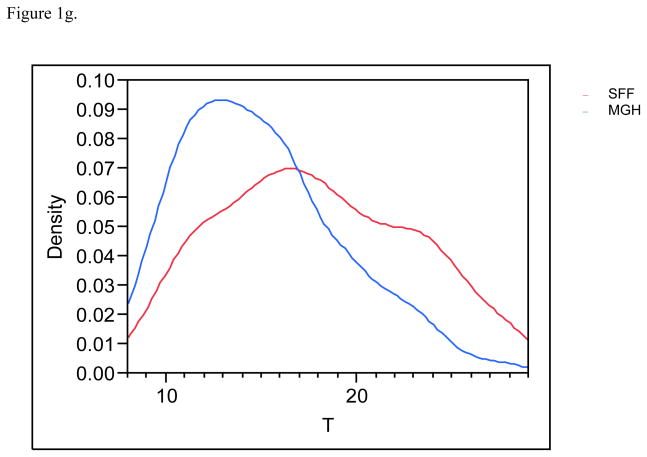
Figure 1.
Figure 1a. Distribution (density) of the serum follicle stimulating hormone (FSH) profiles for SFF and MHG. All data have been truncated to fall between the 5th and 95th percentiles.
Figure 1b. Distribution (density) of the serum luteinizing hormone (LH) profiles for SFF and MHG. All data have been truncated to fall between the 5th and 95th percentiles.
Figure 1c. Distribution (density) of the serum inhibin B profiles for SFF and MHG. All data have been truncated to fall between the 5th and 95th percentiles.
Figure 1d. Distribution (density) of the serum estradiol (E2) profiles for SFF and MHG. All data have been truncated to fall between the 5th and 95th percentiles.
Figure 1e. Distribution (density) of the free androgen index (FAI) profiles for SFF and MHG. All data have been truncated to fall between the 5th and 95th percentiles.
Figure 1f. Distribution (density) of the free testosterone (FT) profiles for SFF and MHG. All data have been truncated to fall between the 5th and 95th percentiles.
Figure 1g. Distribution (density) of the serum testosterone (T) profiles for SFF and MHG. All data have been truncated to fall between the 5th and 95th percentiles.


