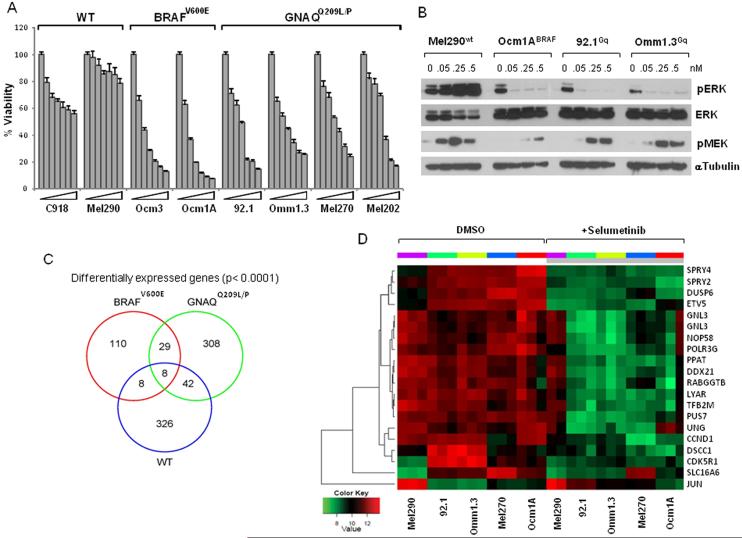
Figure 1. Selumetinib inhibits cell viability of BRAFV600E and GNAQQ209L/P cell lines.
A. Cells with wild-type GNAQ/BRAF (C918, Mel290), mutant GNAQ (92.1, Omm1.3, Mel270, Mel202) and BRAFV600E (OCM3, OCM1A) were treated with increasing concentrations of selumetinib (0, 25, 50, 100, 250, 500, 1000nM), and analyzed for cell viability on day 5, calculated as percent of untreated controls. Data are representative of three independent experiments. Bars, mean s.d. B. Immunoblots of pERK and pMEK in response to increasing concentration of selumetinib in cells with different mutational status. Microarray results: C, Venn-diagram summarizing differentially expressed genes in selumetinib-treated GNAQQ209L/P cell lines (green circle), BRAFV600E (red circle) and WT cells (blue circle), with corresponding overlapping genes as indicated. D, Heat map representation of top 19 genes identified as meeting the statistical threshold (see methods) for significant change in expression in all the cell lines and with fold-change > 2 in GNAQQ209L/P cell lines, in response to 250nM selumetinib (grey bar), or DMSO as control for 8 hours, in triplicate. One replicate of the Mel290 cell line was excluded as it did not cluster with the other two replicates. Cell lines with individual replicates are columns, genes are rows.

