Figure 4.

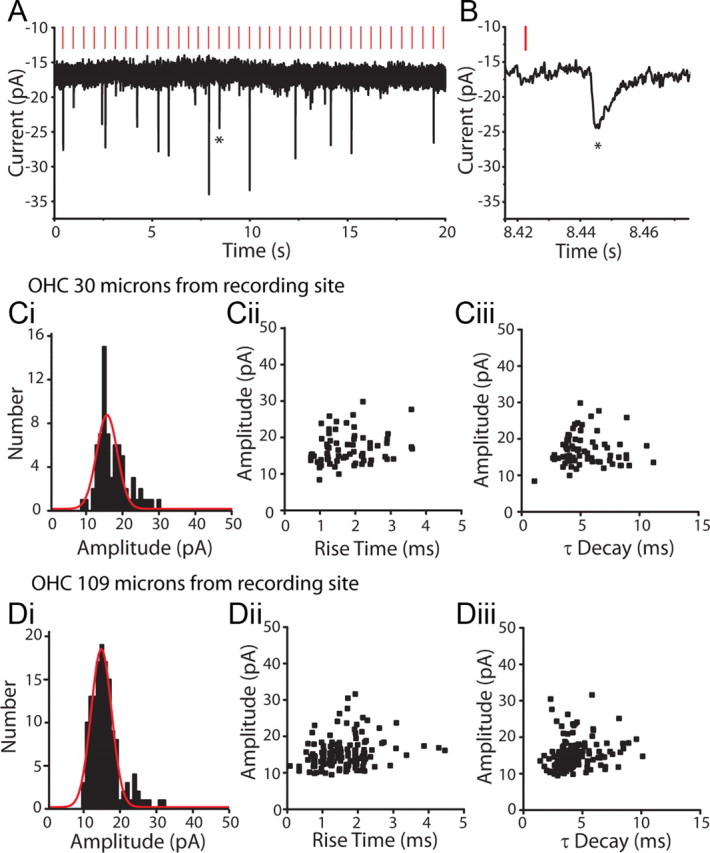
EPSCs evoked in type II afferents by OHC stimulation. A, Voltage-clamp recording from a type II afferent dendrite, holding potential −90 mV. Vertical red lines indicate the timing of a puff of high potassium solution onto a nearby OHC, here 30 μm away. EPSCs visible as downward deflections followed a fraction of puffs onto the OHC. B, Zoom of evoked EPSC from A indicated by star. Ci, Amplitude histogram of EPSCs evoked in a type II afferent by repeated stimulation of a single OHC located 30 μm from the recording site. Red curve represents Gaussian fit of data. Cii, Amplitude by 10–90% rise time scatterplot of EPSCs from Ci. Ciii, Amplitude by time constant of decay (single exponential fit) scatterplot of EPSCs from Ci. Di, Amplitude histogram of EPSCs evoked in the same type II afferent as in Ci, during repeated stimulation of a different OHC 109 μm from the recording site. Red curve represents Gaussian fit of data. Dii, Amplitude by 10–90% rise time scatterplot of EPSCs from Di. Diii, Amplitude by time constant of decay (single exponential fit) scatterplot of EPSCs from Di.
