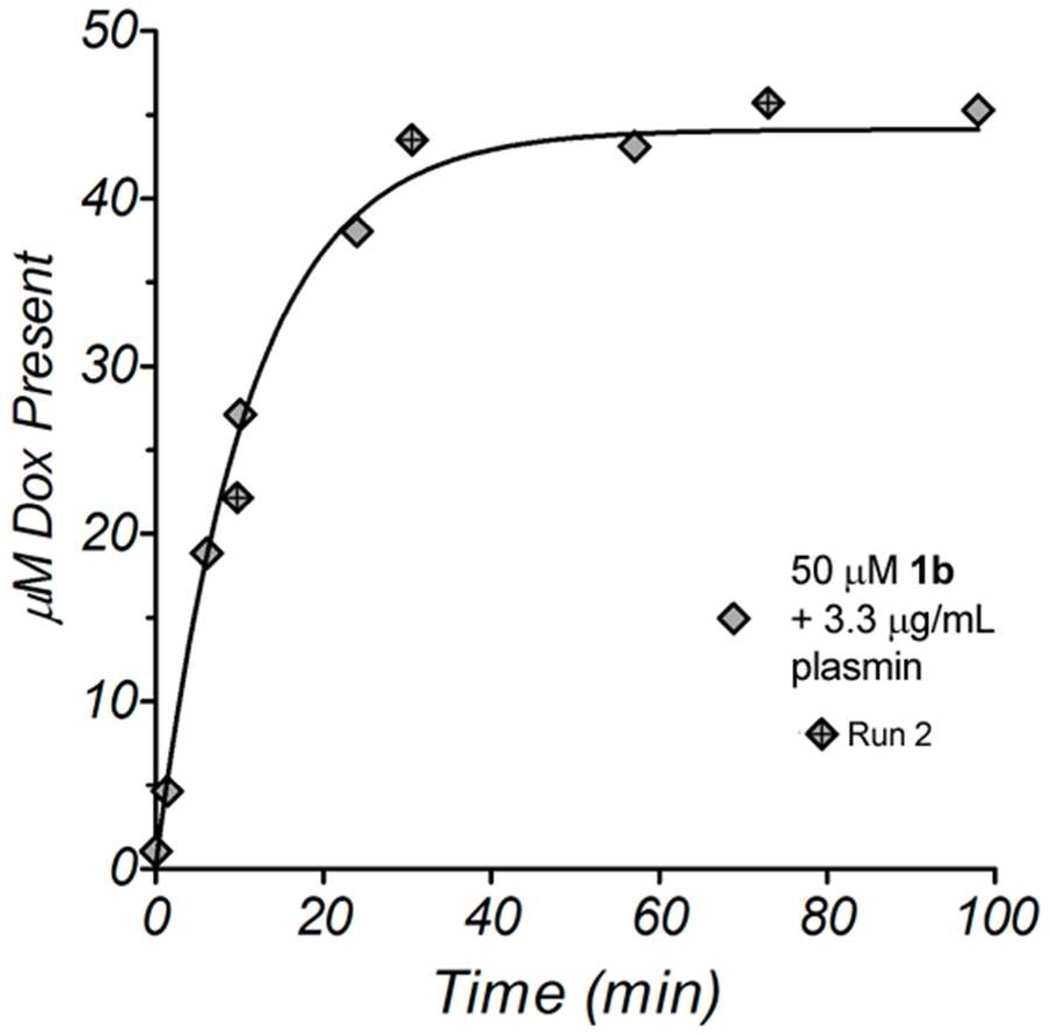
Figure 1.
RP-HPLC analysis of an enzymatic reaction between 50 µM 1b and 3.3 µg/mL human plasmin. The reaction was performed at pH 7.4 in PBS at 37 °C. A second measurement using slightly different reaction times is shown as diamonds with crosses (Run 2). The data were fit using non-linear least squares analysis with a single-exponential association model.

