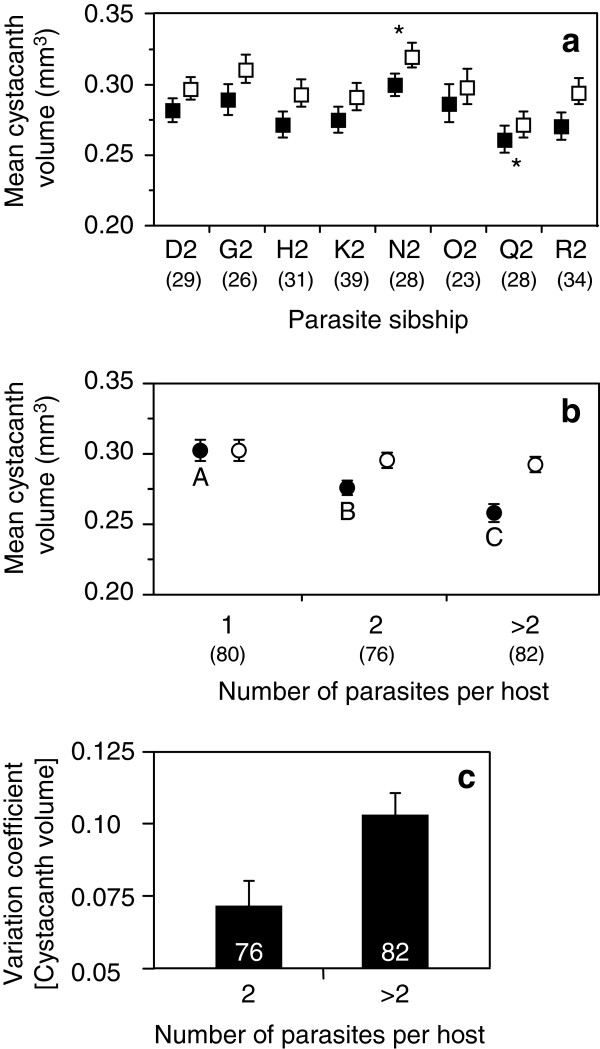
Figure 2.
Variability of mean and largest cystacanth volumes within a host. (a) Effect of parasite sibship on mean cystacanth volume (black symbols) and volume of the largest cystacanth within a host (open symbols). Error bars represent standard errors. Stars indicate sibships where both mean and larger cystacanth volumes were either larger or smaller compared to other sibships (after Tuckey HSD post-hoc test). (b) Effect of infection intensity on mean cystacanth volume (black symbols) and volume of the largest cystacanth within a host (open symbols). Error bars represent standard errors. Symbols marked with different letters indicate significant differences among groups (after Tuckey HSD post-hoc test). (c) Coefficient of variation of mean cystacanth volume within a host according to infection intensity. Numbers in parentheses or inside bars are sample sizes.

