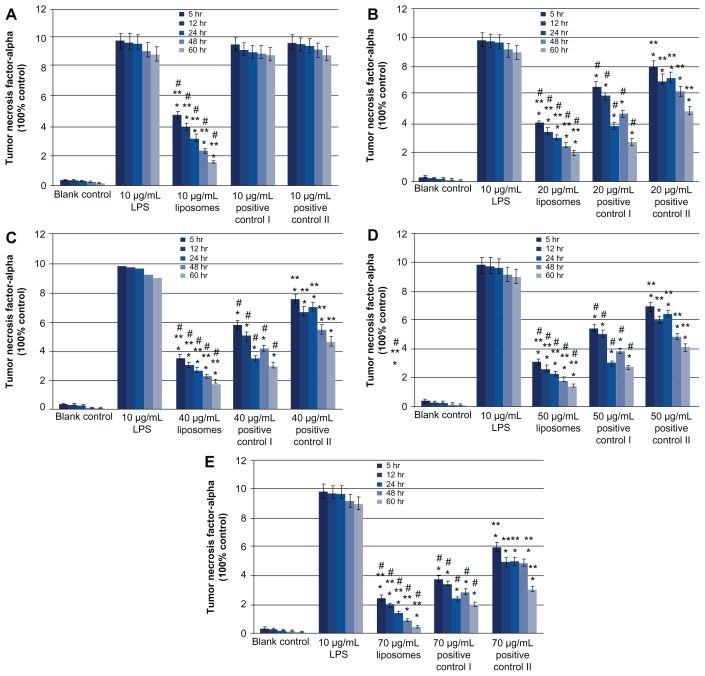
Figure 3.
Quantitative analysis of RT-PCR products of TNF-α mRNA at 6 hours, 12 hours, 24 hours, 48 hours and 60 hours; values are means ± SD from three duplicate experiments. *P < 0.05, different from the value in LPS treated groups; **P < 0.05, different from the value in periocline-treated groups; #P < 0.05, different from the value in 2% minocycline hydrochloride solution treated groups. Drug concentration of experimental group, positive control I and positive control II were 10 (A), 20 (B), 40 (C), 50 (D) and 70 (E) μg/mL respectively.
Abbreviations: Periocline, 2% minocycline hydrochloride gel; RT-PCR, Reverse Transcription-Polymerase Chain Reaction; TNF-α, Tumor necrosis factor-alpha; LPS, Lipopolysaccharide; SD, standard deviation.

