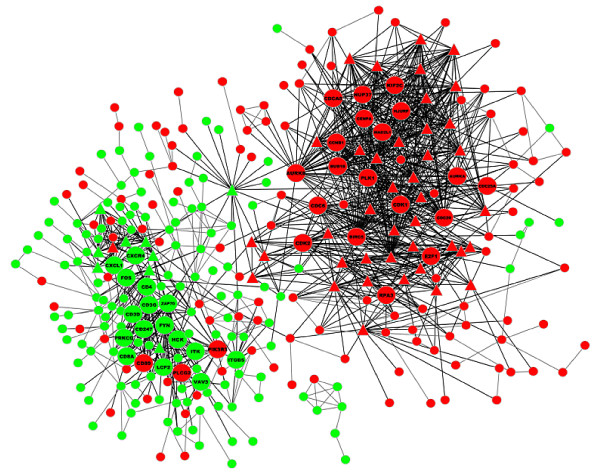
Figure 3.
Interaction networks maps of differentially expressed genes. Up-regulated genes were labeled in red, down-regulated genes were labeled in green. ▵ labeled genes had ≥ 10 joint-edges, labeled nodes were the 38 genes that ranked the top 100 of up-regulated genes or the top 100 of down-regulated genes in the Generank rank. There were 88 nodes with ≥ 10 joint-edges in the map, including 1051 joint-edges, which accounted for 81% of the total.

