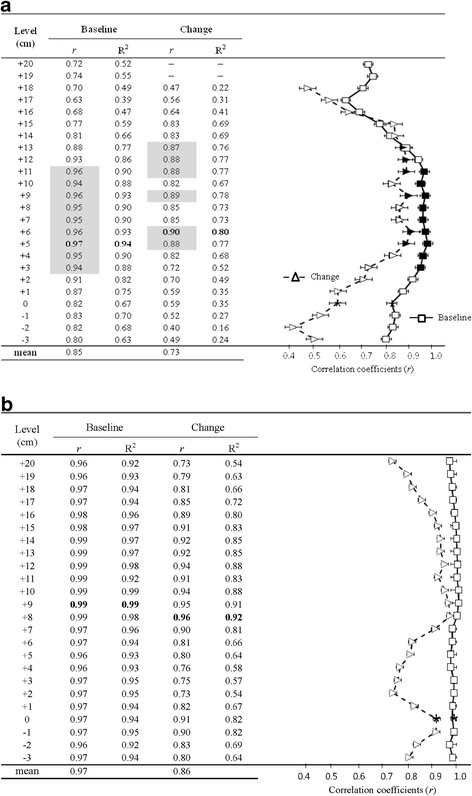
Figure 1 .
The variation in the correlations between the VAT (a) or SAT (b) volumes and the single-slice image areas (right) (Baseline: (□), change: (Δ)); shaded symbols (■ and ▲) indicate significantly greater correlations with volume than that for L4–L5 (Data not shown for 19–20 cm above L4–L5 in VAT, for which there were no significant correlations). (*) indicates the level of L4–L5. Measurement locations were from 3 cm below L4–L5 to 20 cm above L4–L5. n = 24. Bold indicates the highest correlation coefficient. MRI, magnetic resonance imaging. Δ, changes.

