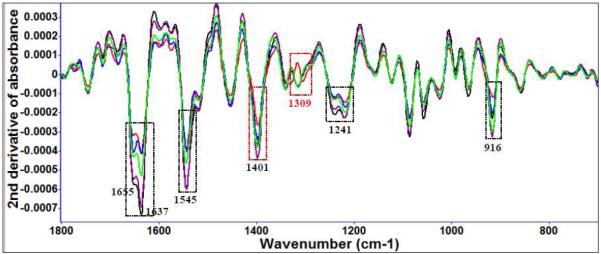
Figure 3 (d).
Second derivative transformation of FT-IR spectral features of L. monocytogenes treated with 25 μl/ml garlic concentrate at 22°C for different time intervals (black: 0 d, purple: 1 d, green: 3 d, blue: 5 d, red: 7 d). The red columns show differences in spectral features treated between garlic concentrate and organosulfur compounds.

