
Figure 2. Force-frequency relationship in the ECU muscle and impact of repetitive tetanic contraction on muscle force and blood flow.
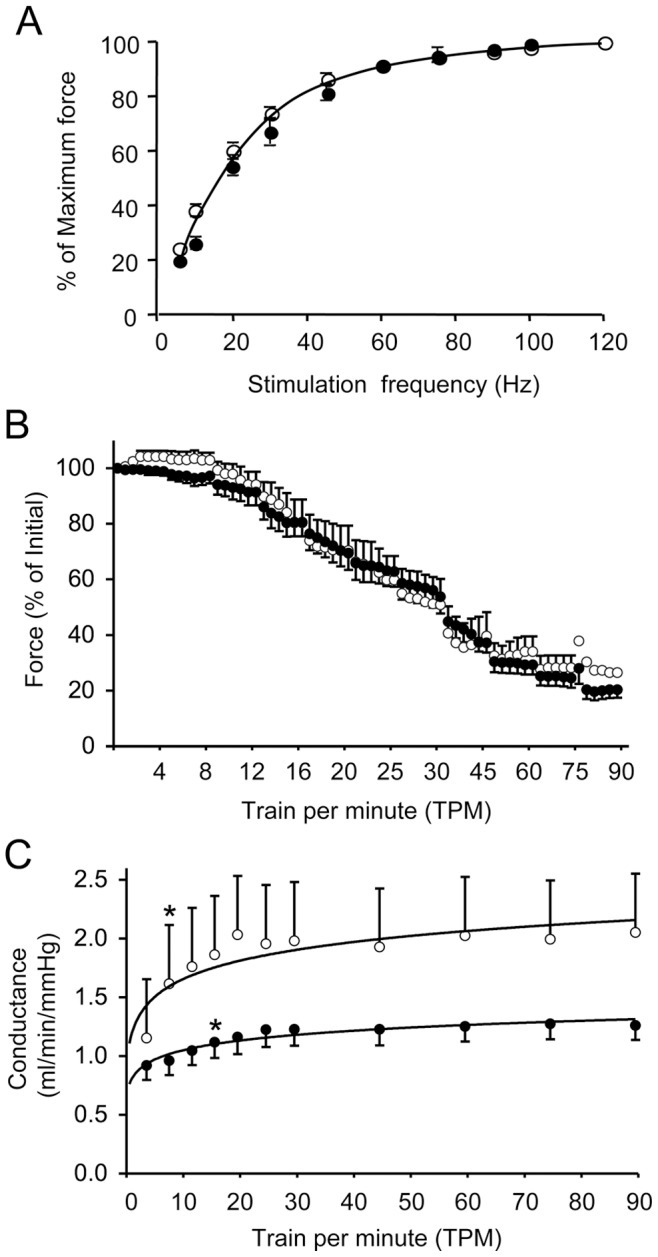
A, Force-frequency relationship in the ECU muscle of normal and dystrophin-null dogs. Single tetanic force at different stimulation frequency was recorded under optimal muscle length (L0). After normalizing to muscle weight, relative tetanic force at each stimulation frequency was calculated as the percentage of the maximal single tetanic force (Table 1). Relative tetanic force was then graphed against stimulation frequency. Data are presented as mean ± standard error of mean. Open circle, normal dogs (n = 4). Closed circle, dystrophic dogs (n = 7). B, Force profile during continuous tetanic stimulation. Uninterrupted stimulation was started at a train frequency of 4 TPM. The train frequency increased every 5 min to 8, 12, 16, 20, 25, 30, 45, 60, 75 and finally 90 TPM. Muscle force was recorded every minute. The tetanic force prior to the start of train stimulation was defined as 100%. Subsequent force change was compared accordingly and expressed as the percent of the starting tetanic force. Open circle, normal dogs (n = 4). Closed circle, dystrophic dogs (n = 7). C, Forearm blood flow conductance (ml/min per mmHg) during continuous tetanic stimulation. Logarithm trend lines are depicted for both normal and affected dogs. Open circle, normal dogs (n = 4). Closed circle, dystrophic dogs (n = 7). Asterisk, significantly different from that of pre-contraction (0 TPM) in the same group. No statistically significant difference was noted between normal and affected dogs by repeated measures analysis of variance (0.1>p>0.05).