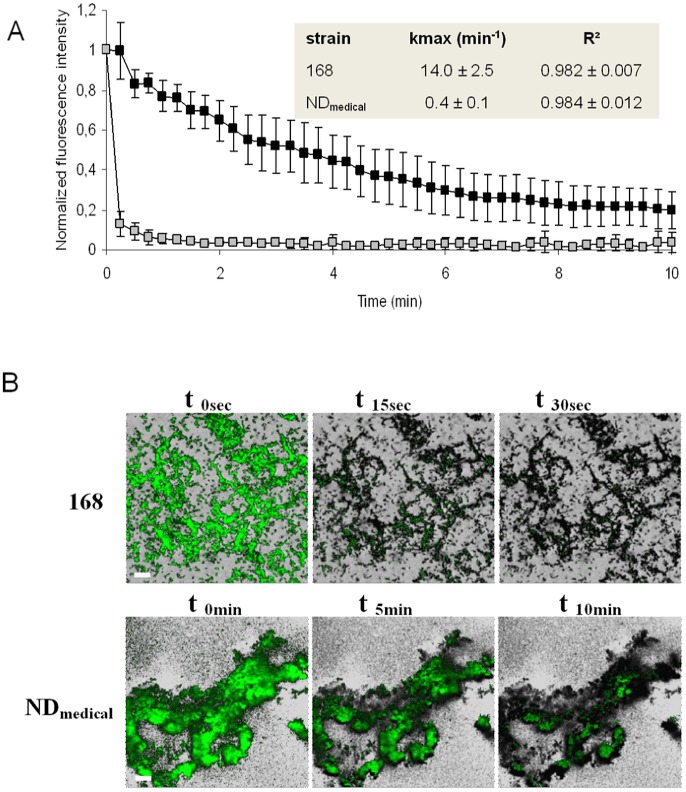
Figure 2. Real-time visualization of PAA (0.05%) activity in B. subtilis biofilms.
(A) Quantification of Chemchrome V6 fluorescence intensity in B. subtilis 168 (white squares) and NDmedical (black squares) biofilms during PAA treatment at 500 ppm. Values shown corresponds to the average of the fluorescence at five depths with standard deviation in the biofilm for a representative experiment. Inactivation rate kmax was obtained after fitting GinaFIT “log linear + tail” inactivation model on experimental data. The means of three experiments ± standard deviation are presented in the inset. (B) Visualization of Chemchrome V6 fluorescence loss (membrane permeabilisation) in B. subtilis 168 and NDmedical biofilms at 0. 15 and 30 secondes and 0. 5 and 10 minutes respectively during PAA treatment (0.05%). Each image corresponds to the superimposition of a green fluorescence image of a representative experiment on a greyscale image of initial fluorescence at the same location. Scale bars correspond to 20 µm.

