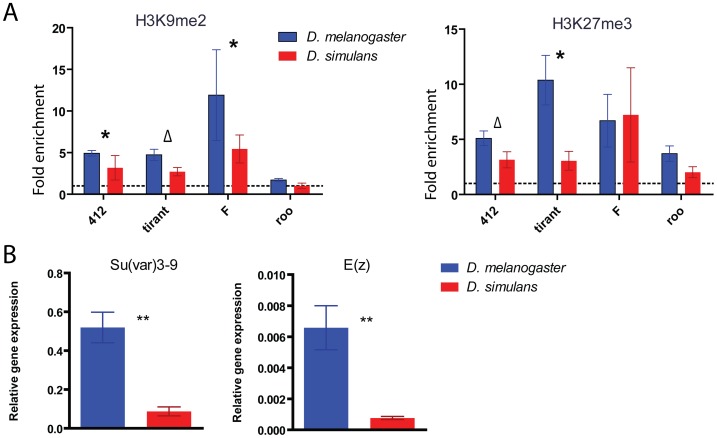
Figure 3. D. melanogaster and D. simulans display differences in TE chromatin state and expression of epigenetic writers.
A. Fold enrichment of H3K9me2 (left panel) and H3K27me3 (right panel) for the four transposable elements studied are depicted per species (mean ± SE). Roo copies show a significant lack of H3K9me2 (Mann Whitney test, p-value <0.05). Histone fold enrichment of each TE family was compared between species and the results of the Mann Whitney test are shown (p-value * <0.05 and Δ <0.1). B. Quantification of RNA steady-state levels of the methyltransferases responsible for H3K9me2 and H3K27me3 deposition (mean ± SE). D. melanogaster (blue), D. simulans (red). Mann Whitney P-values between species are shown with asterisks (p-value ** <0.001).

