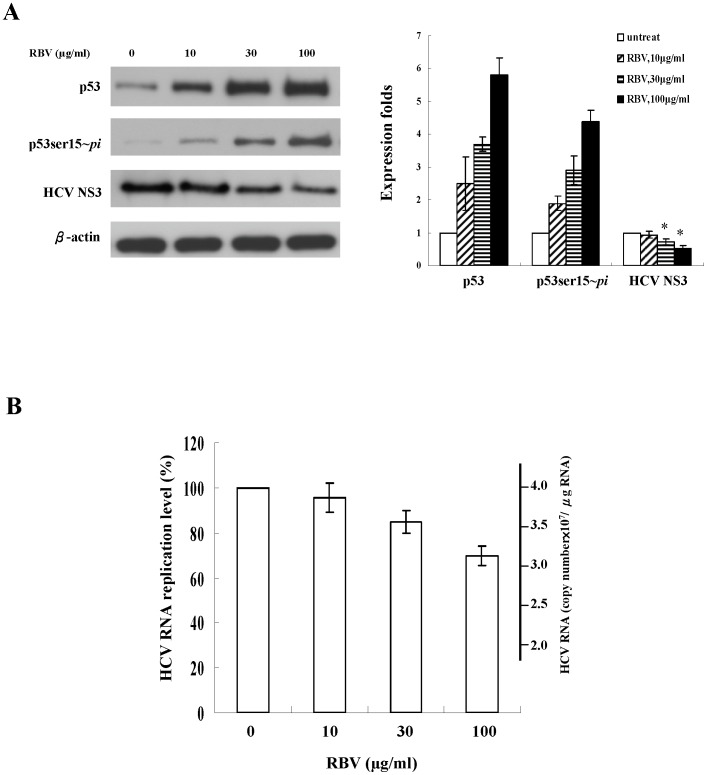
Figure 6. The effect of ribavirin on HCV replication in HCV replicons.
(A) Replicons were treated with the indicated concentration of ribavirin for 48 h. The expression of total p53, phosphorylated p53 at Ser15 (p53ser15∼pi) and HCV NS3 viral proteins was analyzed by immunoblotting. The experiment was independently repeated 5 times and one representative result was shown here. The band intensity of each protein in each experiment was determined by densitometry. The expression fold change of proteins were calculated by dividing the band intensity of the indicated proteins, normalized to that of the loading control β-actin, with that observed in the samples receiving no ribavirin treatment. The results are illustrated by the bar graph located on the right side of the Western blot analysis. Each result represents the mean ± s.e.m of 5 independent measurements and was considered statistically significant at P<0.05. The HCV NS3 protein of each group was compared to those of the reference groups which are untreated cells. *, p<0.05. (B) HCV RNA levels were determined by quantitative RT-PCR. Each result represents the mean ± s.e.m of 5 independent measurements and was considered statistically significant at P<0.05 versus the untreated group. RBV: ribavirin.

