
Figure 2. Confirmation of the nonsense variation at the genomic, transcript, and protein levels for PTCR.
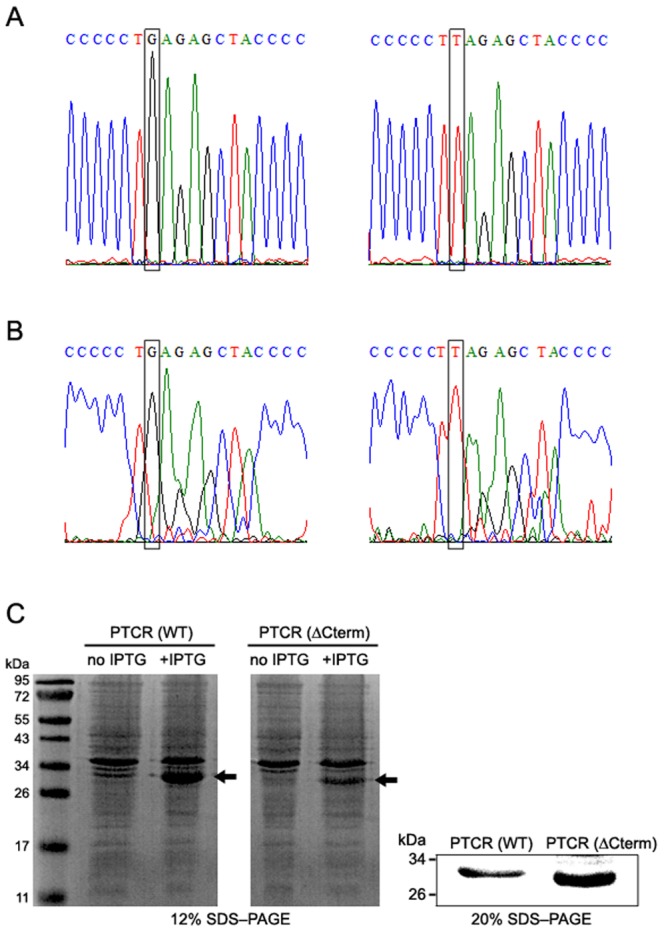
The partial genomic DNA (A) and full length cDNA (B) of PTCR, including the nonsense variation locus, were obtained by PCR using specific primers as described in the ‘Methods’ section and subcloned into the pGEM T easy vector for Sanger sequencing. Boxes indicate different variants (G/T) in an exonic region of genome (A) and at nucleotide 951 of the transcript (B). Expression of PTCR genes with different variants (G/T) was induced in E. coli BL21 by IPTG, and total extracts were loaded onto 12% and 20% SDS-polyacrylamide gels (C). Arrows indicate the His-tagged PTCR fusion proteins of different sizes, about 32 kD or 31 kD, which correspond to PTCR(WT) and PTCR(ΔCterm), respectively.