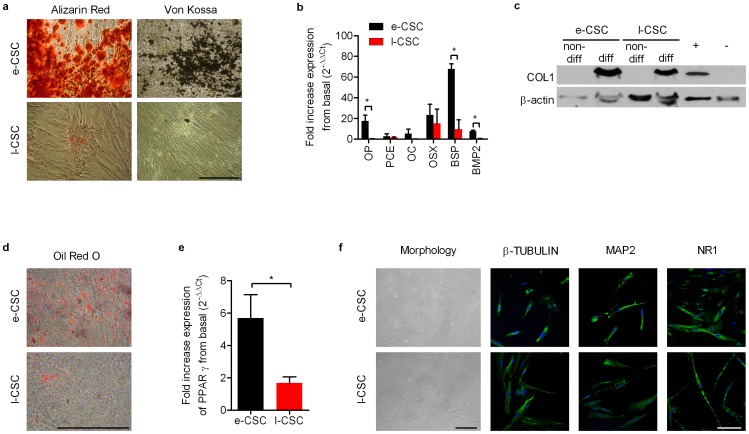
Figure 3. Osteogenic, adipogenic and neurogenic differentiation of e-CSC and l-CSC.
(a) Alizarin red staining (calcium deposits) and von kossa staining (mineralisation) of cells grown in osteogenic permissive media for 2 weeks. (b) Quantitative real time PCR of fold increased expression of osteogenic genes after osteogenic differentiation; osteopontin (OP), procollagen endopeptidase enhancer (PCE), osteocalcin (OC), osterix (OSX), bone sialo-protein-II (BSP) and bone morphogenic protein-2 (BMP2). (c) Western blot of COL1 for e-CSC and l-CSC not differentiated (non-diff) and differentiated to bone for 2 weeks (diff). Positive and negative controls shown. Loading control is β-actin. (d) Oil Red O staining (lipid droplets) of e-CSC and l-CSC grown in adipogenic permissive media for 3 weeks. (e) Quantitative real time PCR of fold increased expression of adipocyte differentiation regulator peroxisome proliferator-activated receptor gamma (PPARγ). (f) Morphology and expression of neuronal markers β-TUBULIN, MAP2 and NMDA receptor NR1 shown with FITC (green) of e-CSC and l-CSC after 5 days neurogenic differentiation. Nuclei stained with DAPI (blue). All quantitative real time PCR data normalised to GAPDH and basal expression levels of differentiation genes (i.e. 2−ΔΔCt). e-CSC (black) and l-CSC (red). Data. * P<0.05; ** P<0.01, Student's t test, n = 3 per cell group. Mean ± s.e.m. All scale bars 100 µm.

