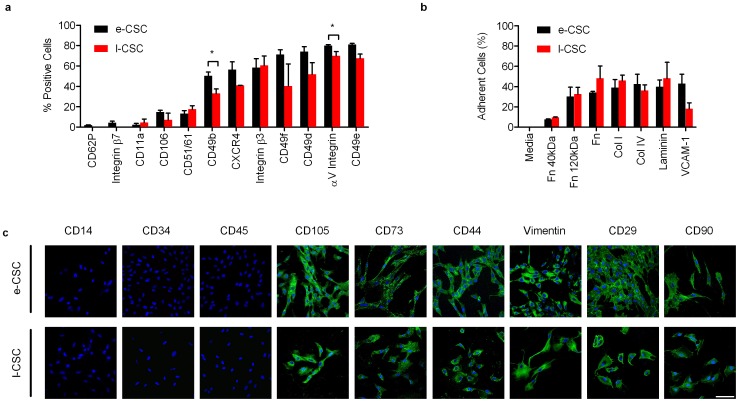
Figure 4. e-CSC and l-CSC have a similar immunophenotype.
(a) Flow cytometry for percent of e-CSC (black) and l-CSC (red) populations positive for surface adhesion markers; CD62P, Integrin β7, CD11a, CD106, CD51/61, CD49b, CXCR4, Integrin β3, CD49f, CD49d, αV Integrin and CD49e. (b) Percentage of e-CSC (black) and l-CSC (red) populations that adhered to fibronectin a-chemotryptic 40 kDa (Fn 40 kDa), fibronectin a-chemotryptic 120 kDa (Fn 120 kDa), whole fibronectin (Fn), collagen I (col I), collagen IV (col IV), human placenta laminin (laminin) and vascular cell adhesion molecule-1 (VCAM-1). Negative control DMEM alone (media). Data. * P<0.05, Student's t test, n = 3 per cell group. Mean ± s.e.m. (c) Confocal immuno-fluorescence for endothelial marker (CD14), hematopoietic markers (CD34 and CD45), MSC-associated markers (CD105, CD73 and CD44), matrix protein (vimentin) and markers found in pluripotent cells as well as MSC (CD29 and CD90) stained with FITC (green). Nuclei stained with DAPI (blue). Scale bar 100 µm. Positive controls are shown in Fig. S3a.

