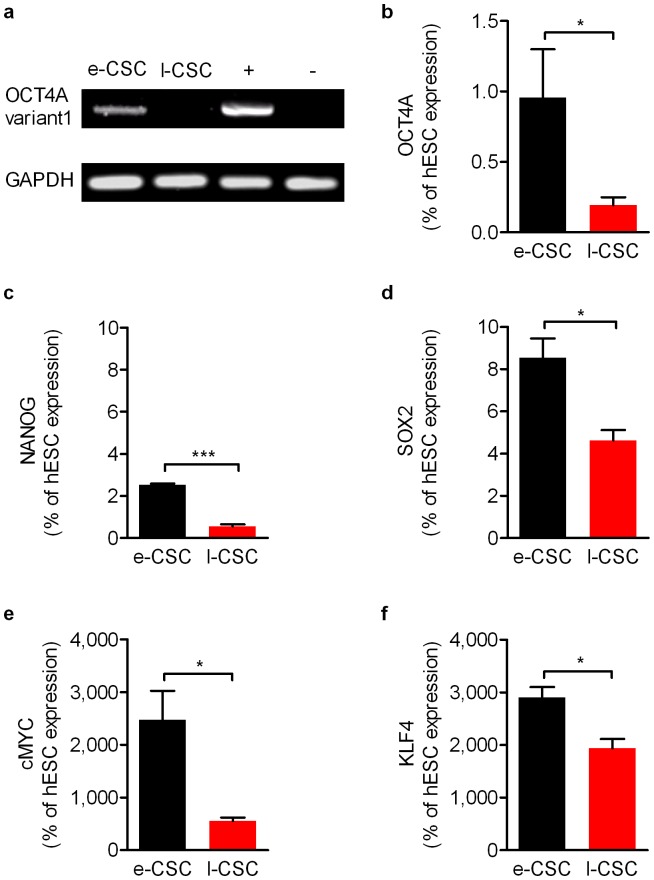
Figure 5. e-CSC have higher expression of pluripotency genes than l-CSC.
(a) RT-PCR for OCT4A variant 1. GAPDH and positive and negative controls shown. (b–f) Quantitative real time PCR for (b) OCT4A all variants, (c) NANOG, (d) SOX2, (e) CMYC and (f) KLF4 for e-CSC (black) and l-CSC (red) as percentage expression of human embryonic stem cells (hESC). * P<0.05; *** P<0.001, Student's t test, n = 4 per cell group. Mean ± s.e.m.

