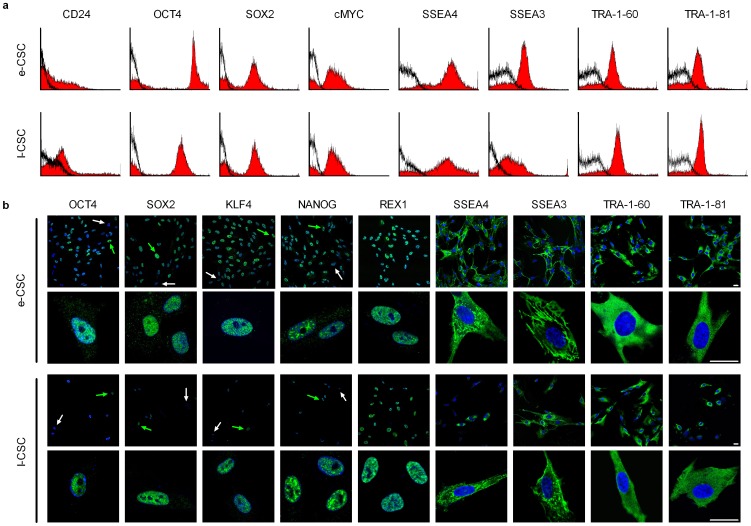
Figure 6. e-CSC and l-CSC contain a subpopulation positive for pluripotency markers.
(a) Representative flow cytometry (n = 3) for percent of cells positive for CD24, OCT4, SOX2, CMYC, SSEA4, SSEA3, TRA-1-60 and TRA-1-81 in e-CSC and l-CSC whole populations (isotype control in black). (b) Representative confocal immunofluorescence images for OCT4, SOX2, KLF4, NANOG, REX1, SSEA4, SSEA3, TRA-1-60 and TRA-1-81 stained with FITC (green). Positive cells indicated with green arrow, negative cells with white arrow. Nuclei stained with DAPI (blue). Scale bar 25 µm. Positive controls are shown in Fig. S3b.

