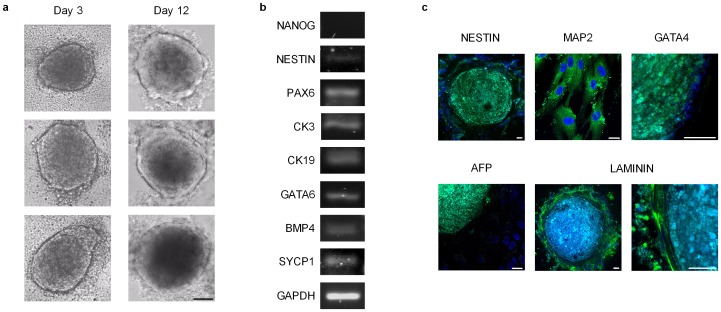
Figure 7. e-CSC uniquely form embryoid bodies (EBs).
(a) Phase contrast image of e-CSC EBs at day 3 and day 12. Scale bar 100 µm. (b) RT-PCR for expression of NANOG, NESTIN, PAX6, CK3, CK19, GATA6, BMP4, SYCP1 and GAPDH in e-CSC EBs. (c) Confocal immuno-fluorescence of e-CSC EBs for expression of NESTIN, MAP2, GATA4, AFP and LAMININ stained with FITC (green). Nuclei stained with DAPI (blue). Scale bars 25 µm. Positive controls are shown in Fig. S3c.

