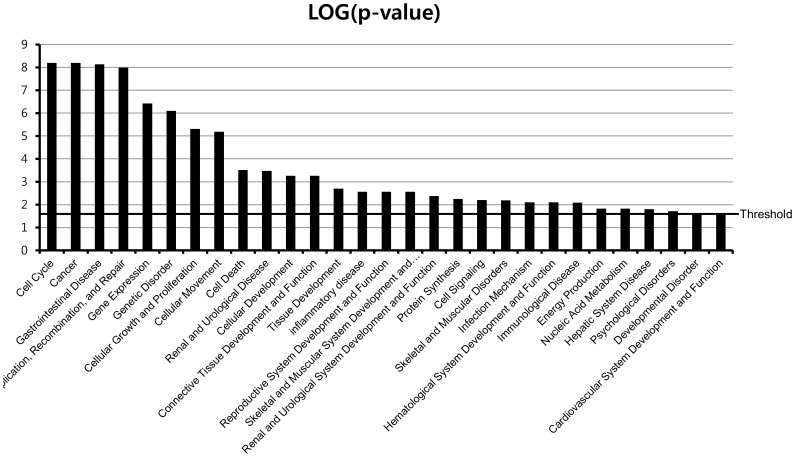
Figure 3. Functional classification of MIBC development-related genes.
Classification enrichment was determined using Ingenuity Pathway Analysis software (version 8.8). The significance of each function was estimated using Fisher’s exact test method. The threshold of statistical significance was -log (P = 0.05).

