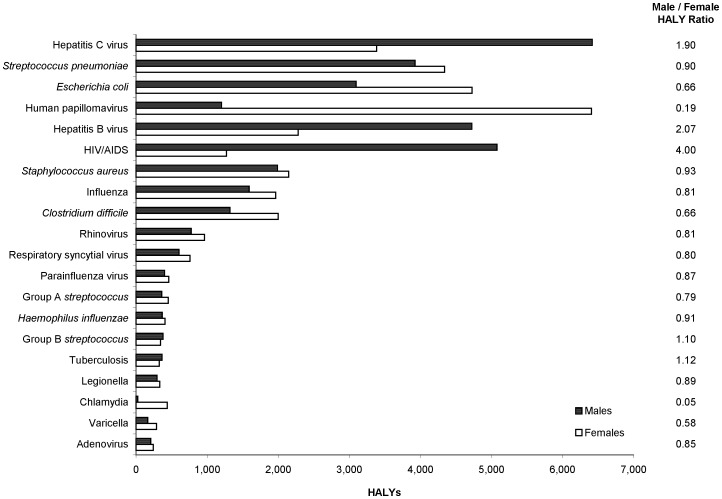
Figure 1. HALYs for the top 20 ranked infectious diseases or pathogens by sex, 2005–07, Ontario, Canada.
For each infectious disease/pathogen, the dark-shaded bars represent the number of HALYs for males and the light-shaded bars represent the number of HALYs for females. The column to the right of the chart displays the male to female ratio of HALYs for each infectious disease/pathogen.

