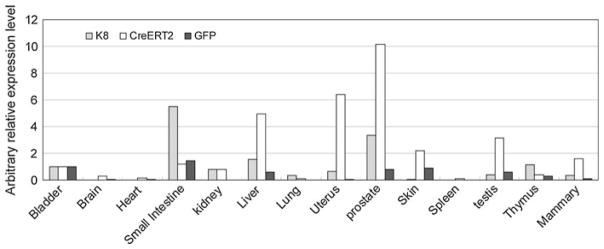
Fig. 2.
A representative quantitative RT–PCR analysis of the expression of CreERT2, GFP and the endogenous K8 gene in a spectrum of tissues in 5-week-old K8–CreERT2 BAC transgenic mice. Bar graph shows the arbitrary relative expression level of each gene, normalized by the expression level in the bladder

