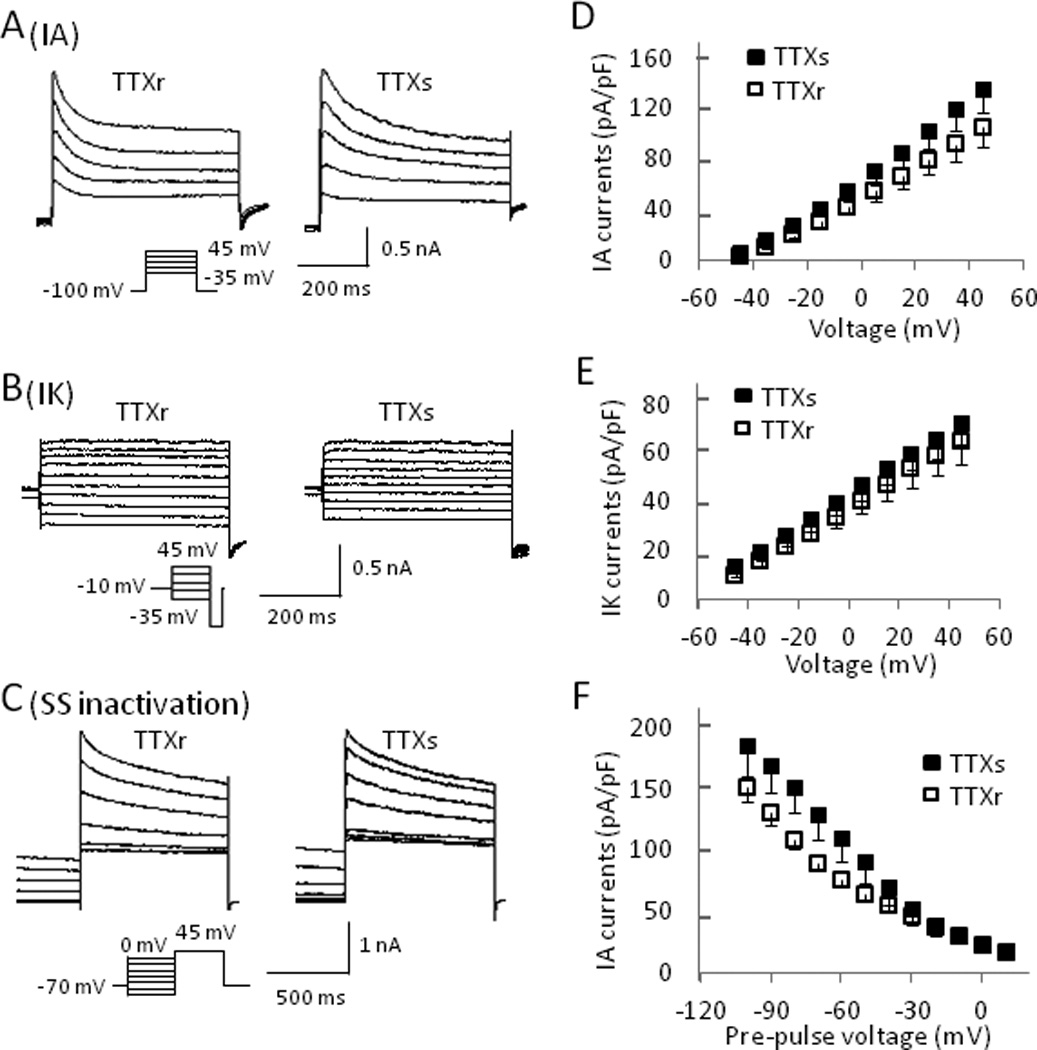
Fig. 5. Comparison of voltage-gated K+ currents in TTXr and TTXs small DRG neurons.

(A&B) Representative traces of IA (A) and IK (B) currents from a TTXr (left) and a TTXs (right) DRG neuron. (C) Traces showing the steady state inactivation of whole K+ currents in a TTXr (left) and a TTXs cell (right). Steady state inactivation protocol consisted of a 2-second pre-pulse voltage step to potentials ranging between −110 and 0 mV followed by a depolarizing step to +45 mV. (D&E) Summary of peak IA (D) and IK (E) currents plotted versus activating potentials from both TTXr and TTXs cells. (F) Summary of peak currents from TTXr and TTXs cells plotted vs. pre-pulse potentials from the steady state inactivation protocol. Current amplitude was normalized by cell capacitance. TTXr cells: n = 8, TTXs cells: n = 8.
