
Figure 3.
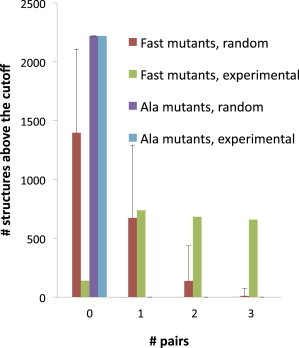
Histograms of a representative cutoff analysis. The histograms show the number of structures (y axis) in which the indicated number of residue pairs (x axis) passed the following filter: ΔΔG‡int > 1.8 kJ/mol and D (inter-residue distance) < 10 Å. The real data is displayed next to the data obtained from 100 random runs (brown and purple bars, with the associated standard deviation), where each ΔΔG‡int value was arbitrarily assigned to a distance between two residues.