
Figure 4.
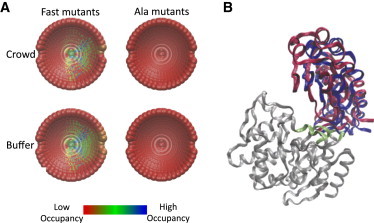
(A) Occupancy maps of the transition state for protein-protein association. Each point represents the center of mass of one of the 2220 perturbed structures. The different colors are related to the cutoff stringency; cooler colors designate a structure that passed a more stringent cutoff filter (thus, has a high occupancy at the transition state structure). The upper two are for measurements done in 15% dextran 40, while the bottom two are for measurements done previously in buffer (8). (B) Representative transition-state structures for the crowding (blue) and buffer (red) analyses. TEM1 is colored in gray with its interacting surface in green.