
Figure 2.
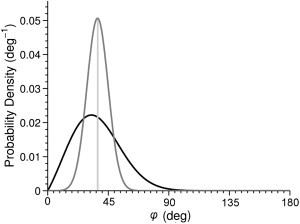
Two different probability density functions can produce identical 〈φ〉 values (vertical line). Therefore, measures of 〈φ〉 alone do not adequately describe the system. For examples, these two probability density functions differ in where the lowest energy molecular tilt (μ) lies—i.e., normal to the membrane (solid) or tilted by 37° (shaded).