
Figure 6.
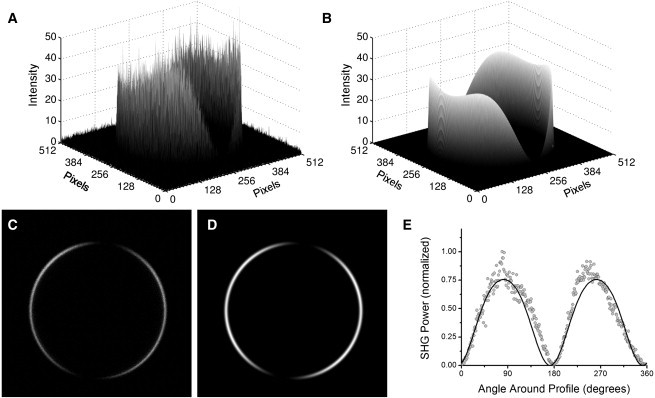
Analysis of an SHG image of di-4-ANEPPS in a monolayer of DPhPC on the surface of a water droplet in oil. The polar-fitting technique renders the SHG image as a surface (A), with signal intensity plotted on the z axis and pixel location on the x and y axis. The parameterized model (B) is also plotted for comparison. Similarly, the two-dimensional SHG image (C) is plotted alongside the two-dimensional parameterized model (D) for comparison, image dimensions: 300 × 300 μm. We also include a plot from analysis of the image by the oval profile method (E). This method considers only a subset of data points (shaded points), which do not accurately represent the image and subsequently is prone to experience more error and a poorer fit (solid line).