
Figure 7.
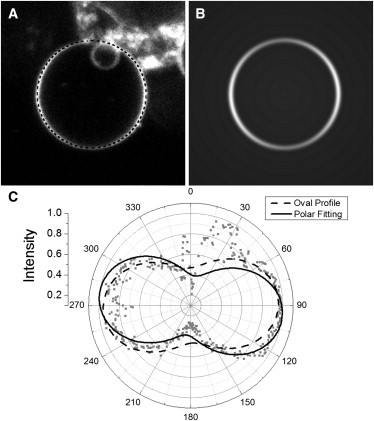
One-photon fluorescence intensity around the equator of (A) a bleb on the exterior of a cultured HeLa cell stained with di-4-ANEPPS and (B) a model image of a single bleb reconstructed from the original image after parameterization, image dimensions: 26.5 × 26.5 μm. (C). This image was processed by using two methods. In the first, the oval profile method extracts data from the delineated area (dotted line) over the bleb. Each fitting technique generates an angular intensity fit that overlays the data (shaded points). The overlap of the signal data with background fluorescence from the cell can be seen as an anomaly on the polar plot from 345° to 60°. The polar fitting (solid line) is less influenced by this anomaly than the oval profile (dashed line), resulting in a better fit.