
Figure 8.
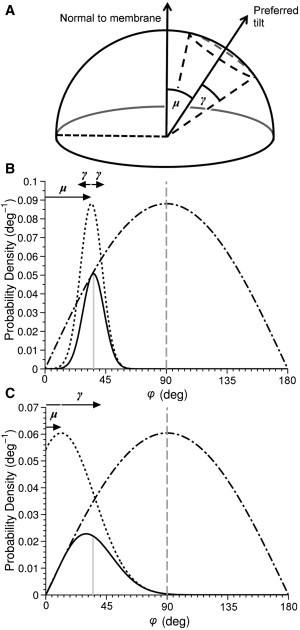
Two distinct tilt probability density functions (solid curves) showing φ (vertical solid line), and their contributing preferred tilt (dotted curves) and statistical (dot-dashed curve) terms. One PDF has a large μ and a small γ (B), whereas the other has a small μ and large γ (C). A representative cartoon (A) shows the physical interpretation of the quantities μ and γ, which may be calculated for given experimentally extracted order parameters.