
Figure 3.
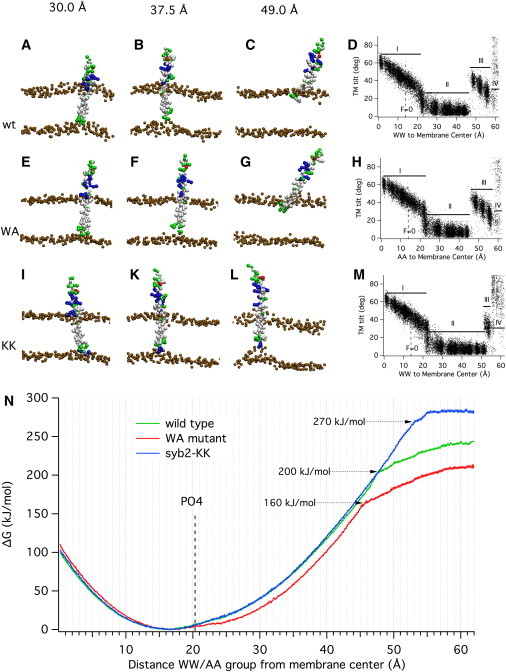
Conformations and energetics of syb2 movement in the membrane. Representative conformations of syb2 WT (A–C), the syb2 WA mutant (E–G), and the syb2-KK construct (I, K, and L) under the influence of harmonic forces pulling the WW/AA group to the target positions indicated at the top with a force constant of 1000 kJ mol−1 nm−2. (D, H, and M) Relation between the TM domain tilt angle relative to membrane normal and the position of the WW group for the syb2 WT (D), syb2 WA mutant (H), and syb2-KK construct (M). For region labels I–IV, see text. (N) Free-energy profiles from CG simulations of the syb2 WT fragment (green), syb2 WA mutant (red), and syb2-KK construct (blue) for pulling the WW/AA group toward the extravesicular side of the membrane. Error estimates for the free-energy values are included in the graph and are typically <2 kJ/mol. The average position of the lipid headgroup CG PO4 particles of the extravesicular leaflet is located at a 20 Å distance (dashed line labeled PO4).