
Figure 4.
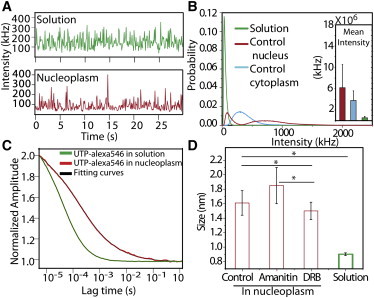
Fluorescent UTPs get incorporated into transcript like RNA aggregates. (A) Raw intensity plots of Alexa546-UTP obtained by FCS measurement in nucleoplasm (red) and in 5 μM solution of Alexa546-UTP (green). (B) Normalized intensity histogram from FCS intensity profiles (pooled from ∼25 independent FCS readings) in Alexa546-UTP in solution, nucleus, and cytoplasm of untreated cells. (C) Fluorescence correlation curves plotted as normalized amplitude and their respective fits with a three-dimensional one-particle anomalous model for Alexa546-UTP in solution and nucleoplasm. (D) Quantification of the mean size of UTP aggregates, estimated from mean correlation time for solution and nucleoplasm (in control and transcription inhibited states) where N ∼ 600 in control and DRB treatment, and N ∼ 500 FCS readings in α-amanitin treatment. ∗P <0.05.