
Figure 5.
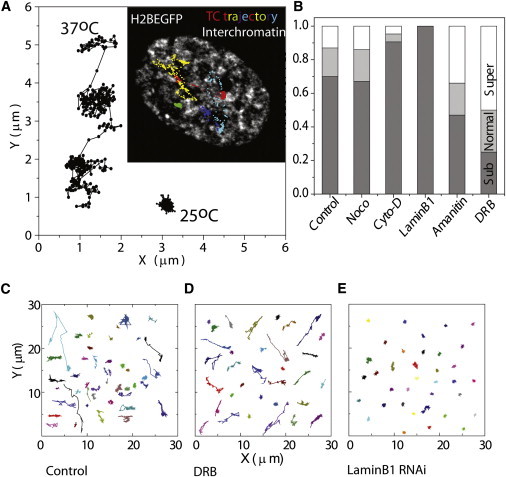
TCs are dynamic in interchromatin territories. (A) TCs labeled with Alexa546-UTP in live HeLa H2BEGFP cells and imaged at 1 frame/6 s for 60 min at a single confocal plane at 37°C and 25°C. (Inset) Merge of trajectories (in color) for centroid positions of five TCs; H2BEGFP shown in gray for HeLa cells imaged at 37°C. Scale bar, 5 μm. (B) Fraction of TCs in normal diffusion, subdiffusion, and superdiffusion according to the α values computed from the MSD of TC trajectories in cells treated with inhibitors perturbing the cytoskeleton, transcription, or nuclear organization for N > 30 TCs in multiple cells. (C) Trajectory of the centroid position of TCs imaged at 1 frame/6 s at 37°C (Control), DRB treatment (D), and laminB1-depleted cells (E).