
Figure 6.
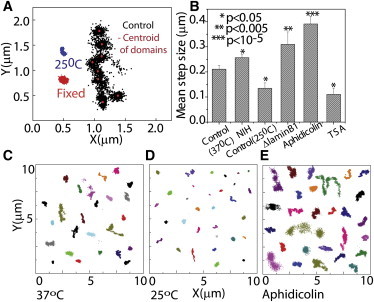
TCs interact with local chromatin mesh. (A) TCs were labeled in live HeLa H2BEGFP cells and imaged at 1 frame/40 ms for 100 s at physiological conditions. Trajectory points of centroid positions of TCs imaged at 37°C (control cells), 25°C (NIH3T3 cells), and paraformaldehyde-fixed cells. The peak of the two-dimensional histogram of the xy trajectories was plotted as the centroid of the domains (plotted in red over the black points of the trajectory). (B) Mean step size computed from the distance between centroids of consecutive domains for different conditions, for N > 30 TCs in multiple cells. Collage of xy trajectories of TCs at 37°C (C) and 25°C (D), and in aphidicolin-treated cells (E). ∗P < 0.05.