
Figure 4.
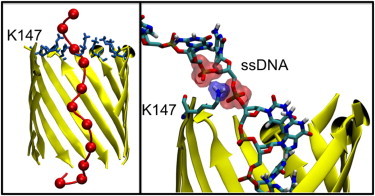
(Left) Dominant cluster in WT protein. The hemolysin barrel is shown in ribbon representation. K147 residues are shown in licorice representation. The DNA backbone is shown in tube format, with phosphorus atoms represented as van der Waals spheres. Water, slab, and ions are omitted for clarity. (Right) Interaction formed between the phosphate group of the DNA backbone and residue K147.