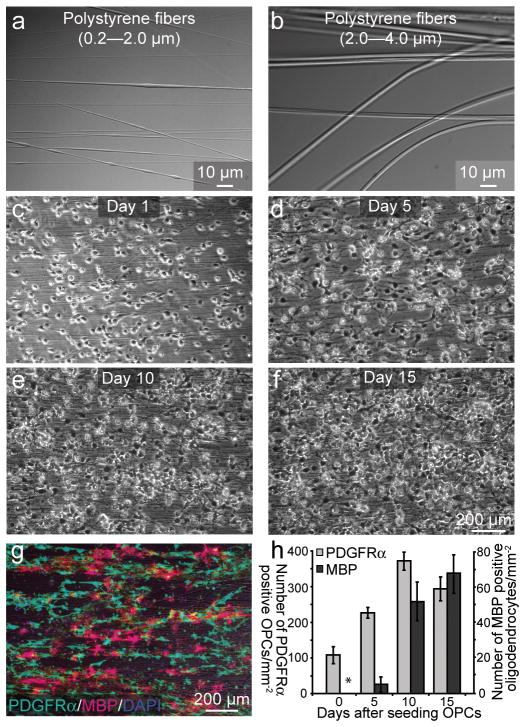
Figure 1.
Temporal and spatial behavior of OPCs on polystyrene fibers are similar to that of OPCs on live axons. (a–f) Phase contrast images of (a, b) polystyrene nanofibers that range in diameter from (a) 0.2–2.0 μm (b) 2.0–4.0μm. (c–f) Bright-field images of cultured OPCs in the presence of exogenous PDGF and polystyrene fibers (0.2–0.4 μm) over 15 days in vitro (DIV). (g) Immunostaining of 10 DIV cultures against the OPC marker PDGFRα and MBP, which labels mature oligodendrocytes. (h) Quantification of the number of PDGFRα+ OPCs and MBP+ oligodendrocytes per millimeter squared on nanofibers as a function of time (n = 3, mean + SD,). Error bars represent SD. Scale bars, 10 μm (a, b), 200 μm (c–g).

