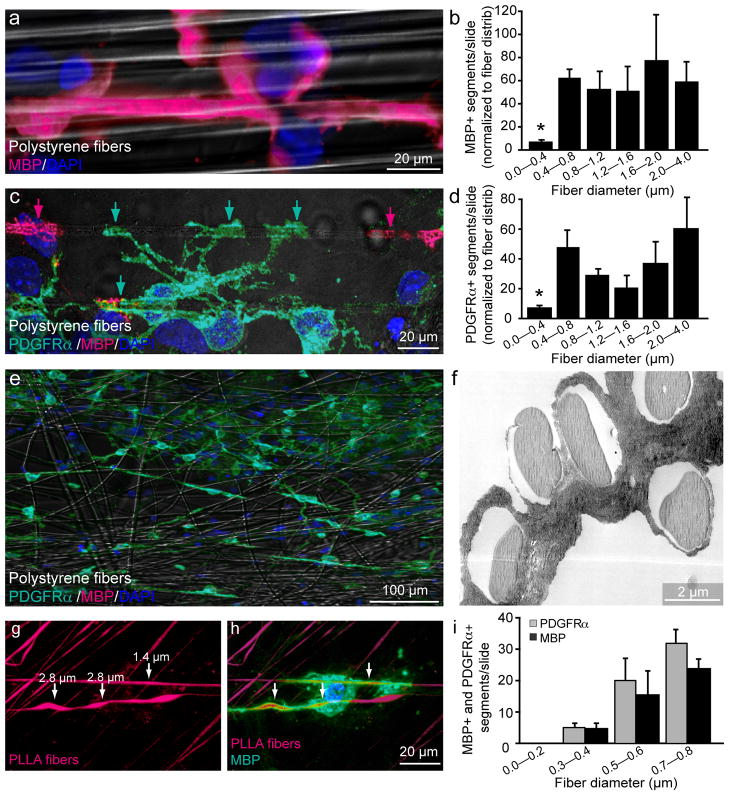
Figure 3.
Quantification of fiber diameter threshold and size preference for ensheathment and wrapping. (a) Immunostaining showing a magnified view of an MBP+ segment formed around a large diameter fiber (2.0–4.0 μm). Cell nuclei are labeled with DAPI (b) Quantification of the number of MBP+ segments normalized to the distribution of fiber diameters (n = 3, mean ± SEM.). (* represents P < 0.001, Tukey post hoc comparison after one-way ANOVA). (c) Immunostaining for PDGFRα and MBP illustrates an PDGFRα+/MBP− OPC in green ensheathing multiple large diameter fibers, as indicated by arrows. PDGFRα−/MBP+ oligodendrocyte segments in magenta (indicated by magenta arrows) are adjacent to the PDGFRα+/MBP− ensheathment. (d) Quantification of PDGFRα+ segments normalized to fiber diameter distribution (n = 3, mean ± SEM)(* represents P < 0.001, Tukey post hoc comparison after one-way ANOVA) (e) Low magnification image of OPC-fiber cultures immunostained at 5 DIV for PDGRα, MBP and DAPI. (f) Electron micrograph of OPC-fiber cultures illustrating ensheathment of multiple large diameter fibers. (g) Image of fibers engineered to display a range of diameter sizes continuously along the same fiber and conjugated with rhodamine. (h) Immunostaining for MBP illustrates an oligodendrocyte wrapping regions of the fiber that are larger in diameter as indicated by arrows. (i) Quantification of fiber diameter preference by binning the number of MBP+ and PDGFRα+ segments in 0.2 μm intervals from 0 to 0.8 μm (n =3, mean ± SEM). (P < 0.001, Tukey post hoc comparison after one-way ANOVA). Scale bars, 20 μm (a, c, h), 100 μm (e), 2 μm (f).

