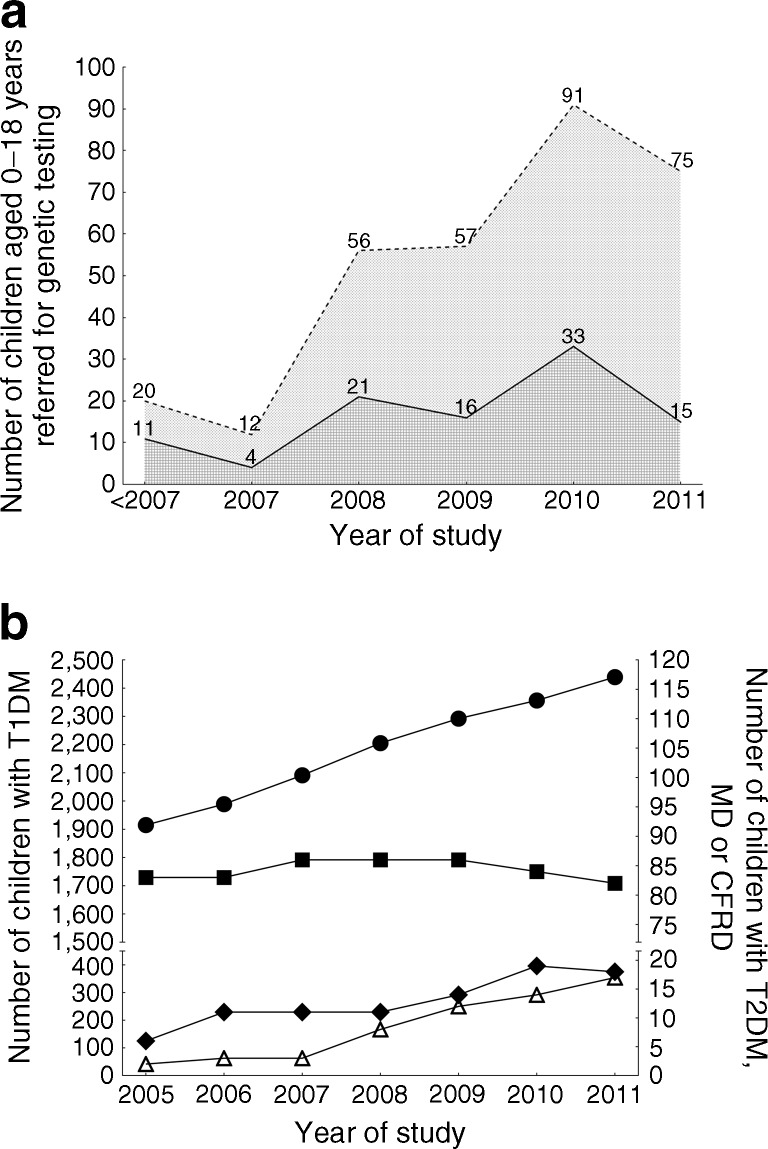
Fig. 1.
(a) Increase of referral rate throughout the study period. The lower area (dark grey) represents patients with positive genetic test results for any kind of MD. The upper area (light grey) represents children referred for genetic testing and with negative genetic test results. GCK-MODY was the most commonly observed form, detected in 83% of children referred for genetic screening, followed by neonatal diabetes (7%), HNF1A/HNF4A-MODY (4%), HNF1B-MODY (2%) and diabetes in Wolfram and Alström syndromes (2% and 1%, respectively). (b) Number of children with type 1 diabetes (T1DM, circles), type 2 diabetes (T2DM, diamonds), monogenic diabetes (MD, squares) and CFRD (triangles) treated at the three study centres throughout the study region. Owing to the rapidly increasing number of children with type 1 diabetes, the percentage of diabetic patients with MD relative to the overall population of diabetic children decreased from 4.1% in 2005 to 3.2% in 2011, while the percentages of type 1 diabetes, type 2 diabetes and CFRD all increased. The left hand axis depicts the number of children with type 1 diabetes, while the right hand axis shows the number of children with monogenic or type 2 diabetes or CFRD

