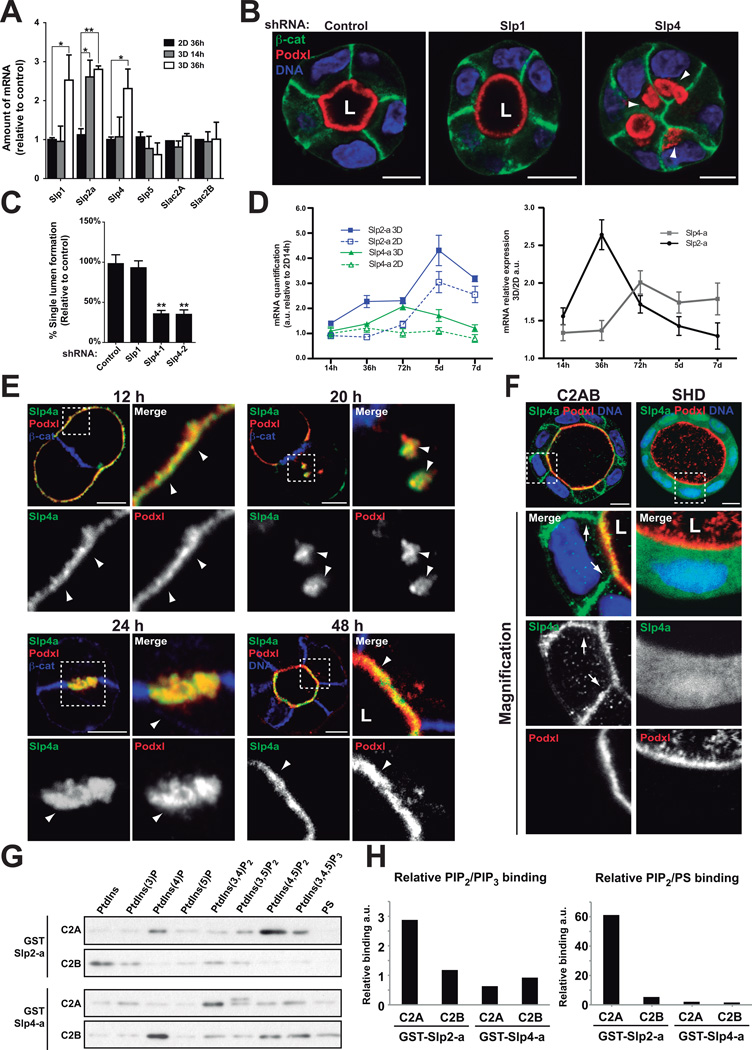
Figure 5. Slp4-a is required for epithelial morphogenesis.
(A) Analysis of Slp and Slac2 expression in 2D vs 3D. Slp1, Slp2-a, Slp4-a, Slp5, Slac2A and Slac2B expression was evaluated at different time points (14h and 36h) by RT-qPCR in MDCK cells grown in 2D and 3D. Slp3, Slac2C and the related Rab27 effectors Noc2 and Rabphilin3 were not expressed in MDCK, n=4
(B) Effect of Slp4-a silencing on lumen formation. Cells stably expressing Slp4, Slp1 or scramble shRNA were plated to form cysts for 72 h. Cells were stained to detect Podxl (red), β-catenin (green), and nuclei (blue). Arrowheads indicate intracellular Podxl-vesicles.
(C) Quantification of cysts with normal lumens in cells expressing scramble, Slp1 or Slp4-a shRNA. (n=3)
(D) Quantification of Slp2-a and Slp4-a mRNA in cells grown on filters or in matrigel. MDCK cells were grown on filters to confluence (2D) or in matrigel (3D). mRNA expression was evaluated at different times by RT-qPCR. Data was normalized to 2D levels at 14h post-plating. Left panel represents Slp2-a (blue lines) and Slp4-a (green lines) mRNA expression patterns in 2D (continuous lines) or 3D (discontinuous lines). Right panel represents mRNA expression as 3D/2D coefficient at different time points, n=3
(E) Localization of GFP-Slp4-a in stably expressing cells during lumen formation. Cysts were stained with Podxl (red) and β-catenin (blue). Arrowheads indicate Slp4-a colocalization with Podxl.
(F) Localization of GFP-Slp4-a C2A/B and SHD during lumen morphogenesis. Cysts were fixed at 96h and co-stained to detect Podxl (red) and β -catenin (blue). Arrows indicate basolateral plasma membrane.
(G) Phospholipids binding ability of Slp2-a and Slp4-a C2 domains. Purified GST-tagged Slp2-a and Slp4-a C2A and C2B domains were incubated with beads covered with phosphoinositides or phosphatidylserine (PS).
(H) Quantification of relative binding of phosphoinositides and PS to Slp2-a and Slp4-a C2 domains. Graphics showing PIP2/PIP3 (left panels) or PS/PIP2 binding ratio (right panels). Note Slp2-a C2A domain binds mainly to PIP2 whereas other C2 domains show similar binding abilities to PIP2, PIP3 or PS.
In all panels values are means ±SD of n independent experiments; Significance: *P < 0.05; **P < 0.005. L, lumen. Bar, 10 µm.

