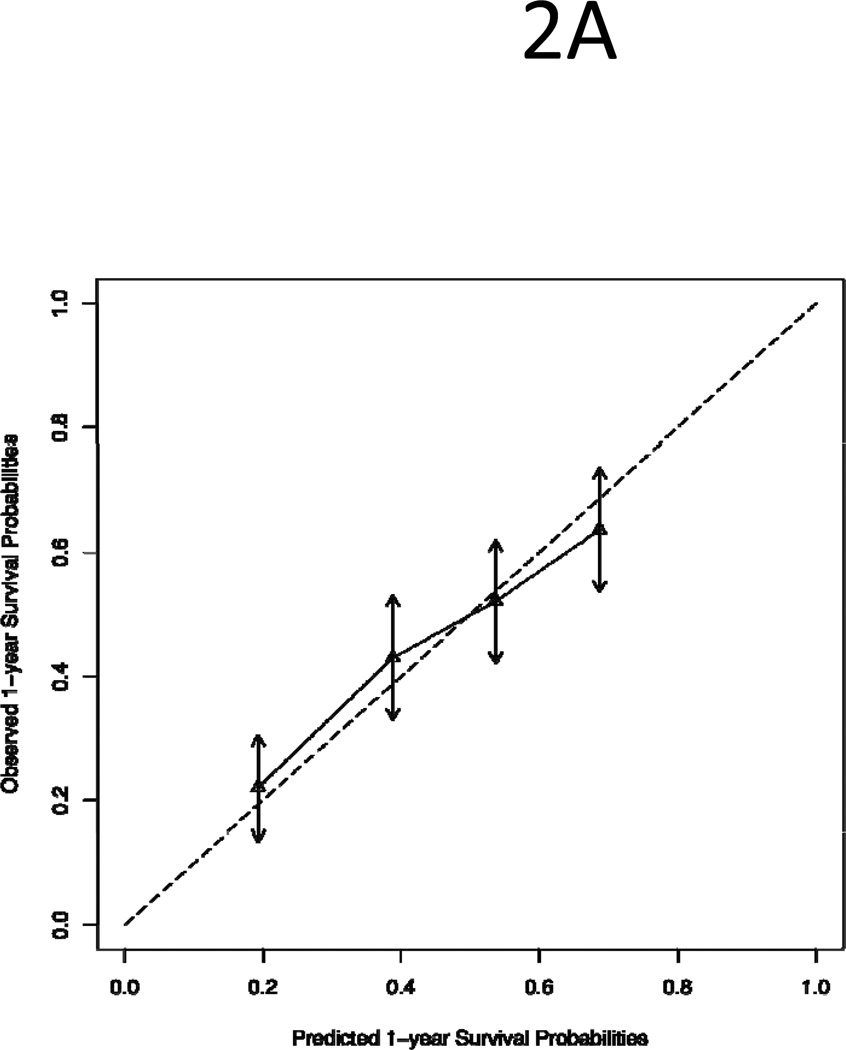
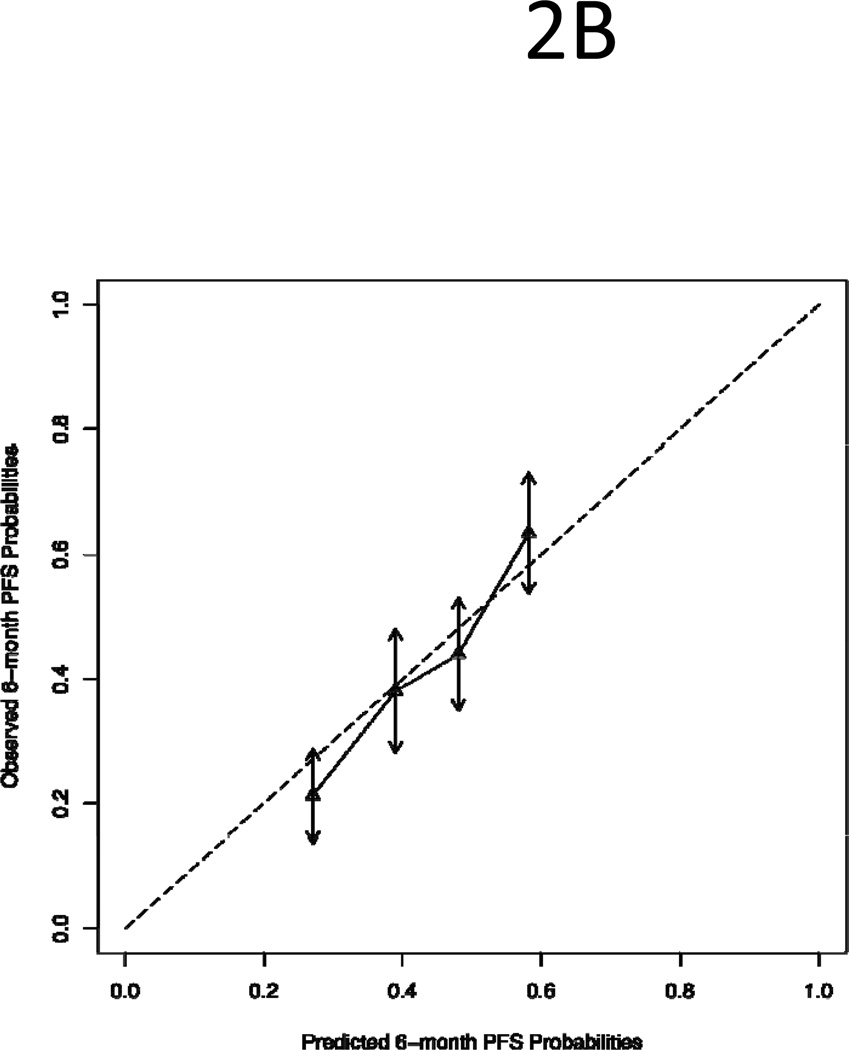
Figure 2.
Comparison of Predicted Survival with Observed Survival of Quartile Groups of Patients in the Validation Set: (A) One-Year Survival; (B) Six-Month Progression Free Survival. The dotted line is the “ideal” line if there is a perfect match between predicted and observed survival. The vertical arrows represent 95% confidence intervals of observed survival.


