
Figure 1. Transition diagram for the SAIS epidemic model for individual i, where Yi is the number of infected neighbors of node i, β is the infection rate, δ is the curing rate, κ is the alerting rate, and βa is the alerted infection rate.
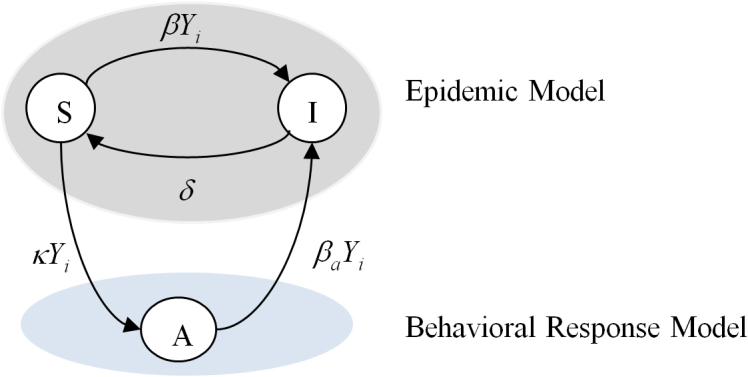
There is a separation between the epidemic model and the response models.