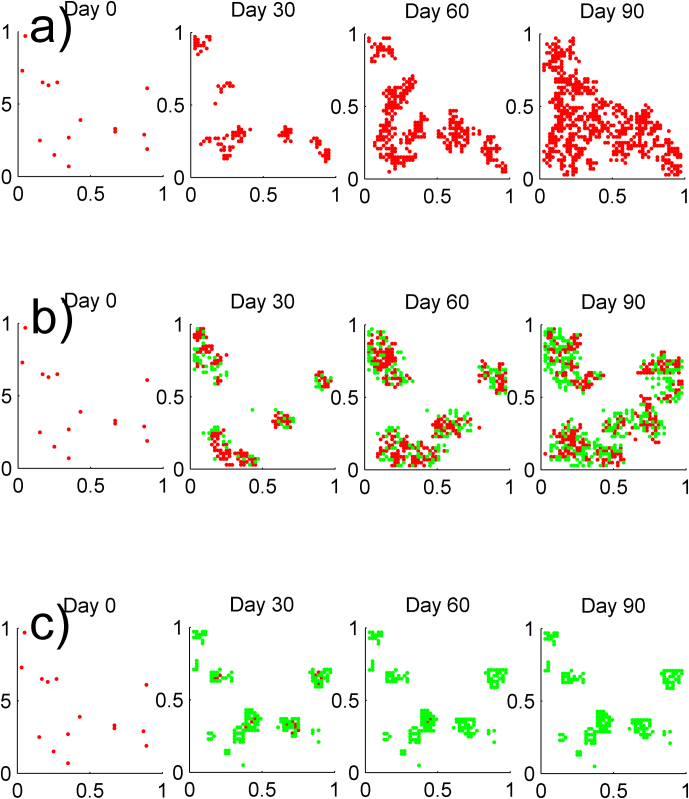
Figure 6.
(a) SIS epidemic spreading on the lattice contact network with R0 = 2.5, δ = 0.1 Day−1. Red dots represent infected nodes, (b) SAIS epidemic spreading with R0 = 2.5, δ = 0.1 Day−1, βa = β/4, and κ = κc/2. Red dots represent infected nodes while the green dots denote the alert nodes. Alertness is reducing the epidemic size for alertness rate κ < κc, (c) SAIS epidemic spreading with R0 = 2.5, δ = 0.1 Day−1, βa = β/2, and κ = 3κc. Red dots represent infected nodes while the green dots denote the alert nodes. Alertness is suppressing the infection for alertness rate κ > κc.

