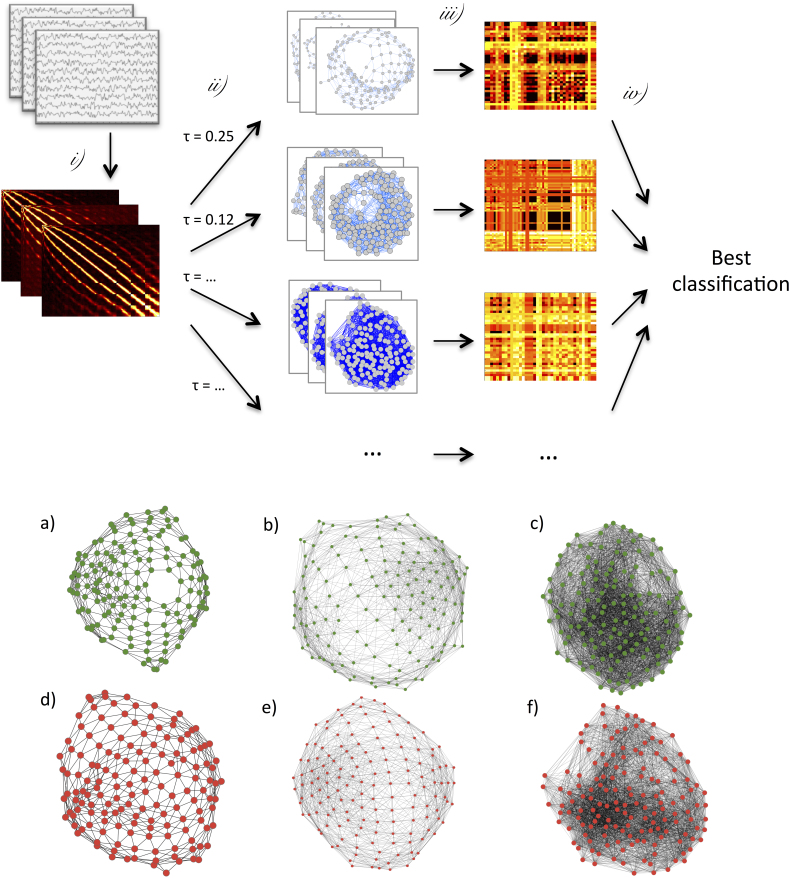
Figure 1. Schematic representation of the network reconstruction process, and examples of the obtained functional networks.
(Top) Sketch of the four phases of the reconstruction process. i) Creation of a weighted clique from multivariate time series, by means of some applicable metric; ii) Transformation of the weighted clique to a set of un-weighted adjacency matrices (representing functional networks) by means of different thresholds; iii) extraction of a set of features for each network, and calculation of all classification scores; iv) selection of the best threshold to be used in step ii), and of the best combination of features. (Bottom) Examples of six networks extracted from the MCI data set (see Methods for details). Networks in green (in red) correspond to healthy (MCI) subjects. The functional networks are those obtained at three different thresholds: (a,d) τ = 0.19 (corresponding to a link density of 0.05), (b,e) τ = 0.1 (link density 0.2), and (c,f) τ = 0.069 (link density 0.43).

