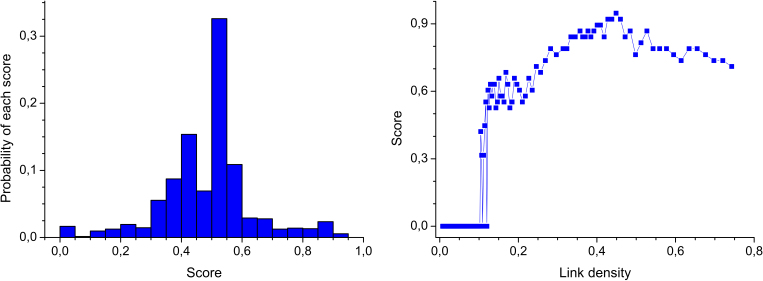
Figure 3. Relevance and stability of the classification results.
(Left Panel) Histogram of the score values obtained with pairs of features for the best threshold value (0.069). (Right Panel) Score obtained with the best feature triplet (i.e., small-worldness, motif 1 ZScore, and entropy of centrality distribution) at different thresholds.

