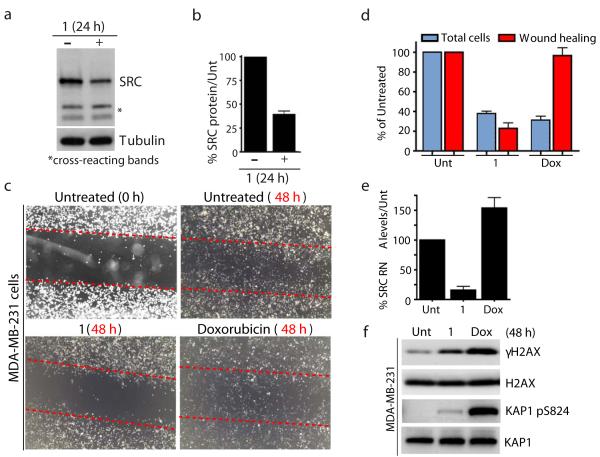
Figure 7. Pyridostatin targeted the proto-oncogene SRC.
(a) Treatment with 1 reduced SRC protein levels; cells were analyzed as in Fig. 1d; cross-reacting bands and tubulin provide loading controls. Full gel images are displayed in Supplementary Fig. 16. (b) Quantification of SRC protein levels upon treatment with 1. SRC quantification from 3 independent experiments was performed using LI-COR Odyssey infrared imaging (LI-COR Biosciences) as described in Supplementary Methods. Error bars represent S.E.M. (c) 1 reduced migration of MDA-MB-231 cells. Migration was assessed by wound healing; dotted red lines denote the edges of the wound area; cells were analyzed 48 h after creating the wound for untreated, 1 (2 μM) and doxorubicin (Dox, 100 nM) treatments, images were captured at 20X with a light microscope. (d) Quantification of experiment in Fig. 7c; cells within equal wound areas for each treatment were trypsinized and counted in duplicate dish for each treatment; data are normalized to untreated samples and represent 3 independent experiments (error bars = S.E.M.). (e) 1 reduced SRC mRNA levels in MDA-MB-231 cells. Untreated, and cells treated with 1 (2 μM) and Dox (100 nM) were taken at 24 h and SRC RNA levels determined as in Fig. 5d. (f) 1 and Dox triggered DNA damage in MDA-MB-231 cells. Untreated, and cells treated with 1 (2 μM) and Dox (100 nM) were collected 48 h post-treatment; proteins were analyzed as in Fig. 1d with the indicated antibodies. Full gel images are displayed in Supplementary Fig. 16.

