Figure 2.
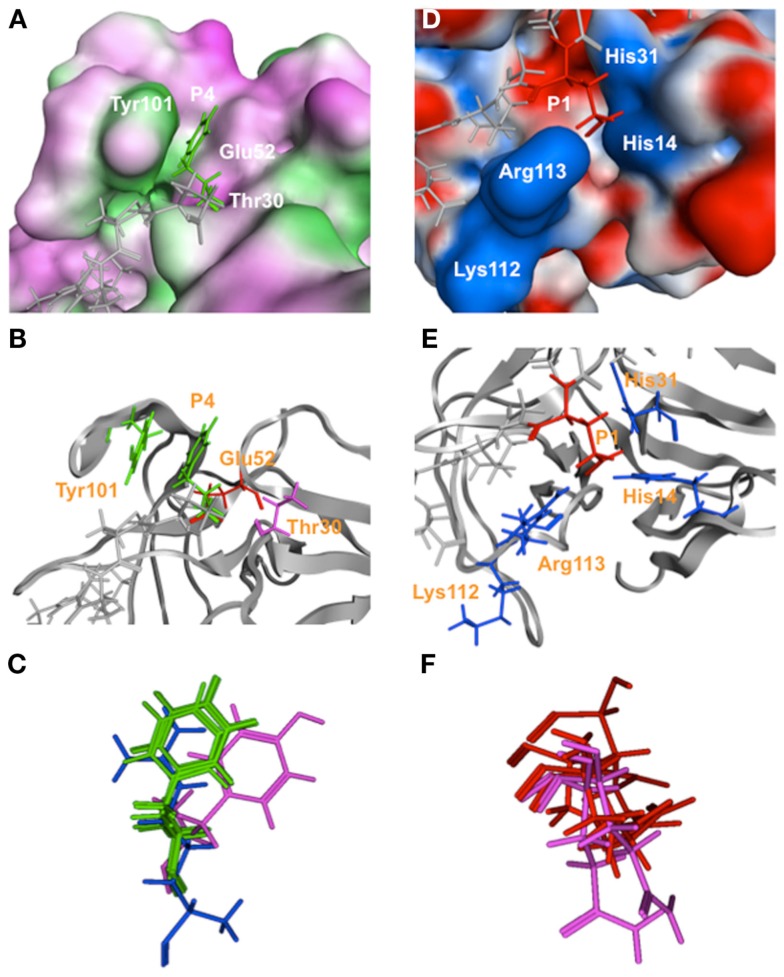
Close-up views of the interaction sites in the protease-substrate complex models. The sites of interactions between the SaV Mc10 protease and the side chains of octapeptides at the P4 (A–C) and P1 (D–F) sites are highlighted. Upper panels show the cleft formed by T30, E52, and Y101, and the positively charged cleft formed by the H14, H31, K112, and R113 of the proteases that are bound to a side chain of the NS6-7/VP1 octapeptide at the P4 (A) and P1 (D) sites. Middle panels show the relative configurations of side chains of the protease bound to a side chain of the NS6-7/VP1 octapeptide at the P4 (B) and P1 (E) sites. Bottom panels show the superposed structures of the side chains of the P4 (C) and P1 (F) amino acid residues of the 6 cleavage sites in the SaV protease-substrate complex models. (C) Green, magenta, and blue sticks represent the side chains of phenylalanine, tyrosine, and arginine, respectively, at the P4 site in the substrate-protease complexes. (F) Red and magenta sticks represent the side chains of glutamic acid and glutamine, respectively, at the P1 site in the substrate-protease complexes.

