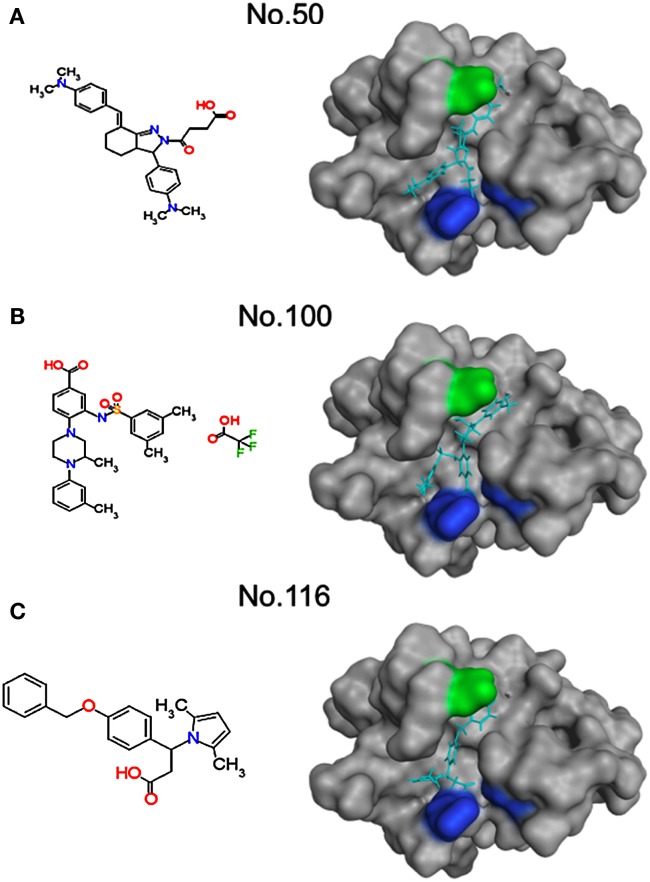
Figure 7.
Structural models of SaV protease docked to the inhibitors. Molecular formulas of the inhibitors (left) and structural models of the inhibitor-protease complexes (right) are shown. Molecular models of the three chemical compounds having anti-SaV-protease activity were constructed using the Molecular Builder tool in MOE. Individual compounds were docked to the SaV protease domain model using the automated ligand docking program ASEDock2005 (Goto et al., 2008). Light blue sticks in the protease indicate inhibitors. Greenish and bluish portions of the protease indicate an aromatic and hydrophobic site and positively charged site, respectively. (A) Compound No.50. (B) Compound No.100. (C) Compound No.116.

