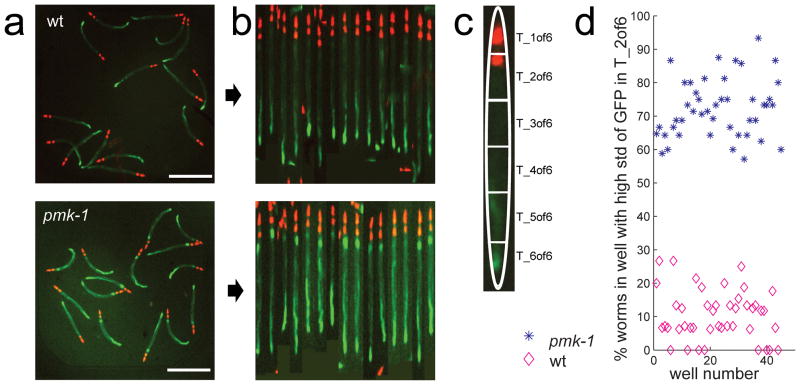
Figure 2.
Scoring fluorescence signal distribution with the WormToolbox. (a) The images show clec-60::GFP expression (green) in wild type worms (top) and in pmk-1(km25) mutants (bottom). The pharynx is marked with myo-2::mCherry (red). (b) Automated worm detection and straightening of the worms in (a) enables feature measurements in relation to (c) a low-resolution worm atlas. (d) Comparison of standard deviation of GFP fluorescence intensity in transversal T_2 of 6 of worms in 48 wells containing either positive (pmk-1 mutant, blue stars) or negative controls (wild type, magenta diamonds).

