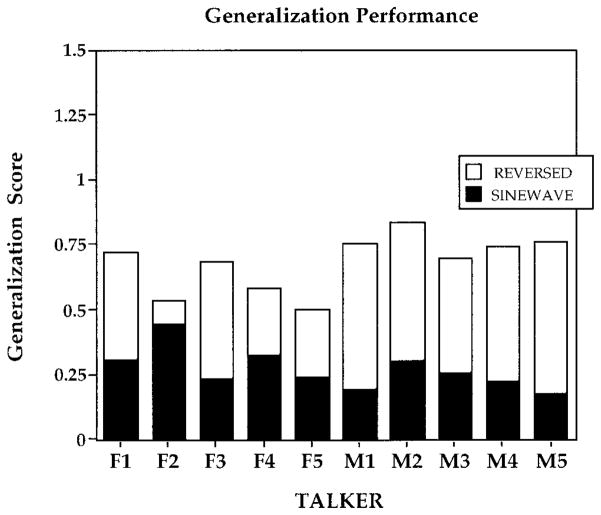
Figure 6.
Mean generalization scores on the reversed speech generalization test and the sinewave replica speech generalization test in Experiment 3. Performance is displayed using a value-added stacked bar graph. Performance on the reversed speech test is represented by the height of the entire bar; performance on the sinewave replica test is represented by the dark section of each bar. Performance is displayed as a function of talker. F1 through F5 refer to the female talkers; M1 through M5 refer to the male talkers.

